
UNITED STATES
SECURITIES AND EXCHANGE COMMISSION
Washington, D.C. 20549
FORM 8-K
CURRENT REPORT
Pursuant to Section 13 or 15(d) of the
Securities Exchange Act of 1934
Date of Report (Date of earliest event reported): November 15, 2018
UNIFI, INC.
(Exact name of registrant as specified in its charter)
| New York | 1-10542 | 11-2165495 | ||
| (State or other jurisdiction of incorporation) |
(Commission File Number) |
(IRS Employer Identification No.) |
7201 West Friendly Avenue
Greensboro, North Carolina 27410
(Address of principal executive offices) (Zip Code)
Registrant’s telephone number, including area code: (336) 294-4410
Check the appropriate box below if the Form 8-K filing is intended to simultaneously satisfy the filing obligation of the registrant under any of the following provisions:
| ☐ | Written communications pursuant to Rule 425 under the Securities Act (17 CFR 230.425) |
| ☐ | Soliciting material pursuant to Rule 14a-12 under the Exchange Act (17 CFR 240.14a-12) |
| ☐ | Pre-commencement communications pursuant to Rule 14d-2(b) under the Exchange Act (17 CFR 240.14d-2(b)) |
| ☐ | Pre-commencement communications pursuant to Rule 13e-4(c) under the Exchange Act (17 CFR 240.13e-4(c)) |
Indicate by check mark whether the registrant is an emerging growth company as defined in Rule 405 of the Securities Act of 1933 (§230.405 of this chapter) or Rule 12b-2 of the Securities Exchange Act of 1934 (§240.12b-2 of this chapter).
Emerging growth company ☐
If an emerging growth company, indicate by check mark if the registrant has elected not to use the extended transition period for complying with any new or revised financial accounting standards provided pursuant to Section 13(a) of the Exchange Act. ☐
| Item 7.01. | Regulation FD Disclosure. |
Unifi, Inc. (the “Company”) will host an Investor Day event in New York City on Thursday, November 15, 2018 beginning at 8:30 a.m. EST, as previously announced in the Company’s press release issued on November 1, 2018, a copy of which is attached hereto as Exhibit 99.1. Members of the Company’s senior management team responsible for marketing, innovation, brand sales, sustainability, supply chain and international operations will join Kevin D. Hall, the Company’s Chairman of the Board and Chief Executive Officer, Thomas H. Caudle, Jr., the Company’s President & Chief Operating Officer, and Jeffrey C. Ackerman, the Company’s Executive Vice President & Chief Financial Officer, to provide a strategic overview of the Company. The half-day program will focus on the Company’s long-term strategic plan and will include discussions on the Company’s commercial capabilities, operations, financials and growth strategy. A live audio webcast and replay of the presentations will be available on the “Investor Relations” section of the Company’s website at www.unifi.com. A copy of the materials prepared for use by management during these presentations, which will also be available on the “Investor Relations” section of the Company’s website at www.unifi.com, is attached hereto as Exhibit 99.2.
| Item 9.01. | Financial Statements and Exhibits. |
(d) Exhibits.
| Exhibit No. |
Description | |
| 99.1 | Press Release of Unifi, Inc., dated November 1, 2018. | |
| 99.2 | Investor Day Presentation Materials. | |
The information in this Current Report on Form 8-K, including the exhibits attached hereto, is being furnished and shall not be deemed to be “filed” for purposes of Section 18 of the Securities Exchange Act of 1934, as amended (the “Exchange Act”), or otherwise subject to the liabilities of that section, nor shall it be deemed to be incorporated by reference in any filing under the Securities Act of 1933, as amended, or the Exchange Act, except as shall be expressly set forth by specific reference in any such filing.
SIGNATURES
Pursuant to the requirements of the Securities Exchange Act of 1934, the registrant has duly caused this report to be signed on its behalf by the undersigned hereunto duly authorized.
| UNIFI, INC. | ||||||||
| Date: November 15, 2018 | By: | /s/ JEFFREY C. ACKERMAN | ||||||
| Jeffrey C. Ackerman Executive Vice President & Chief Financial Officer | ||||||||

Exhibit 99.1
Unifi to Host Investor Day in New York on November 15
GREENSBORO, N.C., November 1, 2018 – Unifi, Inc. (NYSE: UFI), one of the world’s leading innovators in recycled and synthetic yarns, today announced that it will host an Investor Day on Thursday, November 15, 2018 beginning at 8:30 a.m. EST.
Members of the senior management team responsible for marketing, innovation, brand sales, sustainability, supply chain and international operations will join chief executive officer Kevin Hall, chief operating officer Tom Caudle, and chief financial officer Jeff Ackerman to provide a strategic overview of the Company. The half-day program will focus on Unifi’s long-term strategic plan and will include discussions on the Company’s commercial capabilities, operations, financials, and growth strategy.
Webcast Information:
The presentation will be webcast live beginning at 8:30 a.m. Eastern Standard Time (EST). The event can be accessed at the Investor Relations section of www.unifi.com, or investor.unifi.com, where interested parties may listen in and view the slide presentation. The presentation will be archived on the Company’s website for a minimum of 30 days.
For further information about Unifi’s Investor Day event, please contact UFI@alpha-ir.com.
About Unifi:
Unifi, Inc. (NYSE: UFI) is a global textile solutions provider and one of the world’s leading innovators in manufacturing synthetic and recycled performance fibers. The Company’s proprietary PROFIBER™ technologies offer increased performance, comfort and style advantages, enabling customers to develop products that perform, look and feel better. Through REPREVE®, one of Unifi’s proprietary technologies and the global leader in branded recycled performance fibers, Unifi has transformed more than 13 billion plastic bottles into recycled fiber for new apparel, footwear, home goods and other consumer products. Unifi continually innovates technologies to meet consumer needs in moisture management, thermal regulation, antimicrobial, UV protection, stretch, water resistance and enhanced softness. Unifi collaborates with many of the world’s most influential brands in the sports apparel, fashion, home, automotive and other industries. For more information about Unifi, visit www.Unifi.com.
Contact information:
Alpha IR Group
312-445-2870
UFI@alpha-ir.com

Exhibit 99.2 INVESTOR DAY 2018 NOVEMBER 15, 2018Exhibit 99.2 INVESTOR DAY 2018 NOVEMBER 15, 2018

WELCOME, AGENDA 1 A.J. Eaker | VP Finance 2WELCOME, AGENDA 1 A.J. Eaker | VP Finance 2

AGENDA 8:30 am FINANCIAL WELCOME, SAFE INNOVATION 6 1 11 OVERVIEW HARBOR, AGENDA COMPANY CLOSING MARKETING 2 12 7 OVERVIEW REMARKS STRATEGY, 10:15 am Q&A 8 3 13 KEY THEMES BREAK 10:30 am 12:00 pm GLOBAL 14 4 9 GLOBAL SUPPLY CLOSE BRAND SALES CHAIN SOLUTIONS SUSTAINABLE 10 CASE STUDY: ASIA 5 ® POWER OF REPREVE 3AGENDA 8:30 am FINANCIAL WELCOME, SAFE INNOVATION 6 1 11 OVERVIEW HARBOR, AGENDA COMPANY CLOSING MARKETING 2 12 7 OVERVIEW REMARKS STRATEGY, 10:15 am Q&A 8 3 13 KEY THEMES BREAK 10:30 am 12:00 pm GLOBAL 14 4 9 GLOBAL SUPPLY CLOSE BRAND SALES CHAIN SOLUTIONS SUSTAINABLE 10 CASE STUDY: ASIA 5 ® POWER OF REPREVE 3

Cautionary Statement on Forward-Looking Statements Certain statements included herein contain forward-looking statements within the meaning of federal securities laws about the financial condition and results of operations of Unifi that are based on management's beliefs, assumptions and expectations about our future economic performance, considering the information currently available to management. An example of such forward-looking statements include, among others, guidance pertaining to our financial outlook. The words believe, may, could, will, should, would, anticipate, plan, estimate, project, expect, intend, seek, strive and words of similar import, or the negative of such words, identify or signal the presence of forward-looking statements. These statements are not statements of historical fact, and they involve risks and uncertainties that may cause our actual results, performance or financial condition to differ materially from the expectations of future results, performance or financial condition that we express or imply in any forward-looking statement. Factors that could contribute to such differences include, but are not limited to: the competitive nature of the textile industry and the impact of global competition; changes in the trade regulatory environment and governmental policies and legislation; the availability, sourcing and pricing of raw materials; general domestic and international economic and industry conditions in markets where Unifi competes, including economic and political factors over which Unifi has no control; changes in consumer spending, customer preferences, fashion trends and end uses for products; the financial condition of Unifi's customers; the loss of a significant customer or brand partner; natural disasters, industrial accidents, power or water shortages, extreme weather conditions and other disruptions at one of our facilities; the success of Unifi's strategic business initiatives; the volatility of financial and credit markets; the ability to service indebtedness and fund capital expenditures and strategic business initiatives; the availability of and access to credit on reasonable terms; changes in foreign currency exchange, interest and inflation rates; fluctuations in production costs; the ability to protect intellectual property; the strength and reputation of our brands; employee relations; the ability to attract, retain and motivate key employees; the impact of environmental, health and safety regulations; the impact of tax laws, the judicial or administrative interpretations of tax laws and/or changes in such laws or interpretations; the operating performance of joint ventures and other equity method investments; and the accurate financial reporting of information from equity method investees. All such factors are difficult to predict, contain uncertainties that may materially affect actual results and may be beyond our control. New factors emerge from time to time, and it is not possible for management to predict all such factors or to assess the impact of each such factor on Unifi. Any forward-looking statement speaks only as of the date on which such statement is made, and we do not undertake any obligation to update any forward-looking statement to reflect events or circumstances after the date on which such statement is made, except as may be required by federal securities laws. The above and other risks and uncertainties are described in Unifi's most recent annual report on Form 10-K, and additional risks or uncertainties may be described from time to time in other reports filed by Unifi with the Securities and Exchange Commission pursuant to the Securities Exchange Act of 1934, as amended. Non-GAAP Financial Measures Certain non-GAAP financial measures included herein are designed to complement the financial information presented in accordance with GAAP. These non-GAAP financial measures include Earnings Before Interest, Taxes, Depreciation and Amortization ( EBITDA ) and Adjusted EBITDA (together, the non-GAAP financial measures ). EBITDA represents Net income before net interest expense, income tax expense, and depreciation and amortization expense. Adjusted EBITDA represents EBITDA adjusted to exclude equity in loss (earnings) of Parkdale America LLC (“PAL”) and, from time to time, certain other adjustments necessary to understand and compare the underlying results of Unifi. The non-GAAP financial measures are not determined in accordance with GAAP and should not be considered a substitute for performance measures determined in accordance with GAAP. The calculations of the non-GAAP financial measures are subjective, based on management's belief as to which items should be included or excluded in order to provide the most reasonable and comparable view of the underlying operating performance of the business. We may, from time to time, modify the amounts used to determine our non-GAAP financial measures. We believe that these non-GAAP financial measures better reflect Unifi's underlying operations and performance and that their use, as operating performance measures, provides investors and analysts with a measure of operating results unaffected by differences in capital structures, capital investment cycles and ages of related assets, among otherwise comparable companies. Management uses Adjusted EBITDA (i) as a measurement of operating performance because it assists us in comparing our operating performance on a consistent basis, as it removes the impact of (a) items directly related to our asset base (primarily depreciation and amortization) and (b) items that we would not expect to occur as a part of our normal business on a regular basis; (ii) for planning purposes, including the preparation of our annual operating budget; (iii) as a valuation measure for evaluating our operating performance and our capacity to incur and service debt, fund capital expenditures and expand our business; and (iv) as one measure in determining the value of other acquisitions and dispositions. Adjusted EBITDA is a key performance metric utilized in the determination of variable compensation. We also believe Adjusted EBITDA is an appropriate supplemental measure of debt service capacity, because it serves as a high-level proxy for cash generated from operations and is relevant to our fixed charge coverage ratio. Equity in loss (earnings) of PAL is excluded from Adjusted EBITDA because such results do not reflect our operating performance. In evaluating non-GAAP financial measures, investors should be aware that, in the future, we may incur expenses similar to the adjustments included herein. Our presentation of non-GAAP financial measures should not be construed as indicating that our future results will be unaffected by unusual or non-recurring items. Each of our non-GAAP financial measures has limitations as an analytical tool, and you should not consider it in isolation or as a substitute for analysis of our results or liquidity measures as reported under GAAP. Some of these limitations are (i) it is not adjusted for all non-cash income or expense items that are reflected in our statements of cash flows; (ii) it does not reflect the impact of earnings or charges resulting from matters we consider not indicative of our ongoing operations; (iii) it does not reflect changes in, or cash requirements for, our working capital needs; (iv) it does not reflect the cash requirements necessary to make payments on our debt; (v) it does not reflect our future requirements for capital expenditures or contractual commitments; (vi) it does not reflect limitations on or costs related to transferring earnings from our subsidiaries to us; and (vii) other companies in our industry may calculate this measure differently than we do, limiting its usefulness as a comparative measure. Because of these limitations, these non-GAAP financial measures should not be considered as a measure of discretionary cash available to us to invest in the growth of our business or as a measure of cash that will be available to us to meet our obligations, including those under our outstanding debt obligations. You should compensate for these limitations by relying primarily on our GAAP results and using these measures only as supplemental information. 4Cautionary Statement on Forward-Looking Statements Certain statements included herein contain forward-looking statements within the meaning of federal securities laws about the financial condition and results of operations of Unifi that are based on management's beliefs, assumptions and expectations about our future economic performance, considering the information currently available to management. An example of such forward-looking statements include, among others, guidance pertaining to our financial outlook. The words believe, may, could, will, should, would, anticipate, plan, estimate, project, expect, intend, seek, strive and words of similar import, or the negative of such words, identify or signal the presence of forward-looking statements. These statements are not statements of historical fact, and they involve risks and uncertainties that may cause our actual results, performance or financial condition to differ materially from the expectations of future results, performance or financial condition that we express or imply in any forward-looking statement. Factors that could contribute to such differences include, but are not limited to: the competitive nature of the textile industry and the impact of global competition; changes in the trade regulatory environment and governmental policies and legislation; the availability, sourcing and pricing of raw materials; general domestic and international economic and industry conditions in markets where Unifi competes, including economic and political factors over which Unifi has no control; changes in consumer spending, customer preferences, fashion trends and end uses for products; the financial condition of Unifi's customers; the loss of a significant customer or brand partner; natural disasters, industrial accidents, power or water shortages, extreme weather conditions and other disruptions at one of our facilities; the success of Unifi's strategic business initiatives; the volatility of financial and credit markets; the ability to service indebtedness and fund capital expenditures and strategic business initiatives; the availability of and access to credit on reasonable terms; changes in foreign currency exchange, interest and inflation rates; fluctuations in production costs; the ability to protect intellectual property; the strength and reputation of our brands; employee relations; the ability to attract, retain and motivate key employees; the impact of environmental, health and safety regulations; the impact of tax laws, the judicial or administrative interpretations of tax laws and/or changes in such laws or interpretations; the operating performance of joint ventures and other equity method investments; and the accurate financial reporting of information from equity method investees. All such factors are difficult to predict, contain uncertainties that may materially affect actual results and may be beyond our control. New factors emerge from time to time, and it is not possible for management to predict all such factors or to assess the impact of each such factor on Unifi. Any forward-looking statement speaks only as of the date on which such statement is made, and we do not undertake any obligation to update any forward-looking statement to reflect events or circumstances after the date on which such statement is made, except as may be required by federal securities laws. The above and other risks and uncertainties are described in Unifi's most recent annual report on Form 10-K, and additional risks or uncertainties may be described from time to time in other reports filed by Unifi with the Securities and Exchange Commission pursuant to the Securities Exchange Act of 1934, as amended. Non-GAAP Financial Measures Certain non-GAAP financial measures included herein are designed to complement the financial information presented in accordance with GAAP. These non-GAAP financial measures include Earnings Before Interest, Taxes, Depreciation and Amortization ( EBITDA ) and Adjusted EBITDA (together, the non-GAAP financial measures ). EBITDA represents Net income before net interest expense, income tax expense, and depreciation and amortization expense. Adjusted EBITDA represents EBITDA adjusted to exclude equity in loss (earnings) of Parkdale America LLC (“PAL”) and, from time to time, certain other adjustments necessary to understand and compare the underlying results of Unifi. The non-GAAP financial measures are not determined in accordance with GAAP and should not be considered a substitute for performance measures determined in accordance with GAAP. The calculations of the non-GAAP financial measures are subjective, based on management's belief as to which items should be included or excluded in order to provide the most reasonable and comparable view of the underlying operating performance of the business. We may, from time to time, modify the amounts used to determine our non-GAAP financial measures. We believe that these non-GAAP financial measures better reflect Unifi's underlying operations and performance and that their use, as operating performance measures, provides investors and analysts with a measure of operating results unaffected by differences in capital structures, capital investment cycles and ages of related assets, among otherwise comparable companies. Management uses Adjusted EBITDA (i) as a measurement of operating performance because it assists us in comparing our operating performance on a consistent basis, as it removes the impact of (a) items directly related to our asset base (primarily depreciation and amortization) and (b) items that we would not expect to occur as a part of our normal business on a regular basis; (ii) for planning purposes, including the preparation of our annual operating budget; (iii) as a valuation measure for evaluating our operating performance and our capacity to incur and service debt, fund capital expenditures and expand our business; and (iv) as one measure in determining the value of other acquisitions and dispositions. Adjusted EBITDA is a key performance metric utilized in the determination of variable compensation. We also believe Adjusted EBITDA is an appropriate supplemental measure of debt service capacity, because it serves as a high-level proxy for cash generated from operations and is relevant to our fixed charge coverage ratio. Equity in loss (earnings) of PAL is excluded from Adjusted EBITDA because such results do not reflect our operating performance. In evaluating non-GAAP financial measures, investors should be aware that, in the future, we may incur expenses similar to the adjustments included herein. Our presentation of non-GAAP financial measures should not be construed as indicating that our future results will be unaffected by unusual or non-recurring items. Each of our non-GAAP financial measures has limitations as an analytical tool, and you should not consider it in isolation or as a substitute for analysis of our results or liquidity measures as reported under GAAP. Some of these limitations are (i) it is not adjusted for all non-cash income or expense items that are reflected in our statements of cash flows; (ii) it does not reflect the impact of earnings or charges resulting from matters we consider not indicative of our ongoing operations; (iii) it does not reflect changes in, or cash requirements for, our working capital needs; (iv) it does not reflect the cash requirements necessary to make payments on our debt; (v) it does not reflect our future requirements for capital expenditures or contractual commitments; (vi) it does not reflect limitations on or costs related to transferring earnings from our subsidiaries to us; and (vii) other companies in our industry may calculate this measure differently than we do, limiting its usefulness as a comparative measure. Because of these limitations, these non-GAAP financial measures should not be considered as a measure of discretionary cash available to us to invest in the growth of our business or as a measure of cash that will be available to us to meet our obligations, including those under our outstanding debt obligations. You should compensate for these limitations by relying primarily on our GAAP results and using these measures only as supplemental information. 4

TODAY’S PRESENTERS Kevin Hall | Chairman and CEO Jeff Ackerman | EVP & CFO Jay Hertwig | GVP of Brand Sales Meredith Boyd | VP of Brand Sales Helen Sahi | VP of Sustainability Richard Gerstein | EVP of PVA Tom Caudle | President and COO Sohan Mangaldas | VP of Supply Chain Hongjun Ning | VP Unifi Asia, Europe, Africa 5TODAY’S PRESENTERS Kevin Hall | Chairman and CEO Jeff Ackerman | EVP & CFO Jay Hertwig | GVP of Brand Sales Meredith Boyd | VP of Brand Sales Helen Sahi | VP of Sustainability Richard Gerstein | EVP of PVA Tom Caudle | President and COO Sohan Mangaldas | VP of Supply Chain Hongjun Ning | VP Unifi Asia, Europe, Africa 5
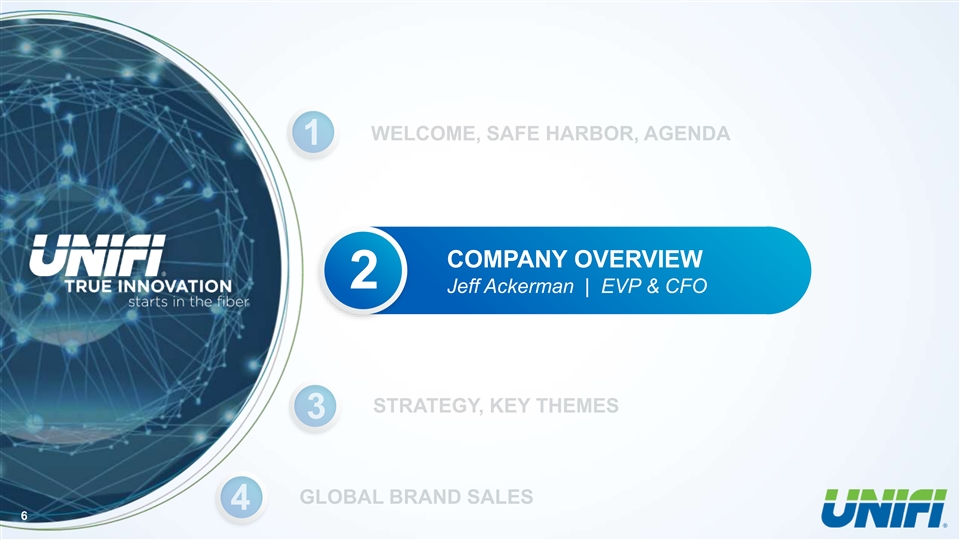
COMPANY OVERVIEW 2 Jeff Ackerman | EVP & CFO 6COMPANY OVERVIEW 2 Jeff Ackerman | EVP & CFO 6
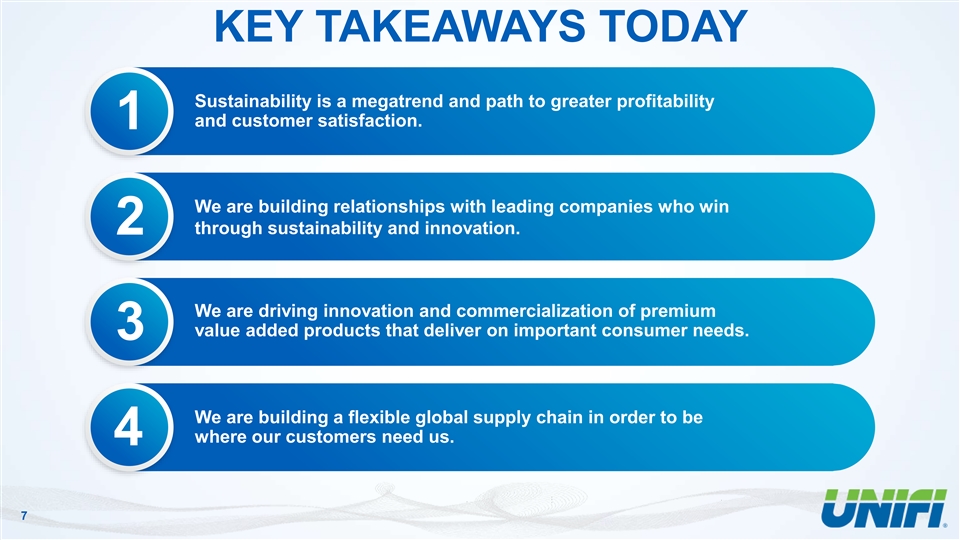
KEY TAKEAWAYS TODAY Sustainability is a megatrend and path to greater profitability and customer satisfaction. 1 We are building relationships with leading companies who win through sustainability and innovation. 2 We are driving innovation and commercialization of premium value added products that deliver on important consumer needs. 3 We are building a flexible global supply chain in order to be where our customers need us. 4 7KEY TAKEAWAYS TODAY Sustainability is a megatrend and path to greater profitability and customer satisfaction. 1 We are building relationships with leading companies who win through sustainability and innovation. 2 We are driving innovation and commercialization of premium value added products that deliver on important consumer needs. 3 We are building a flexible global supply chain in order to be where our customers need us. 4 7
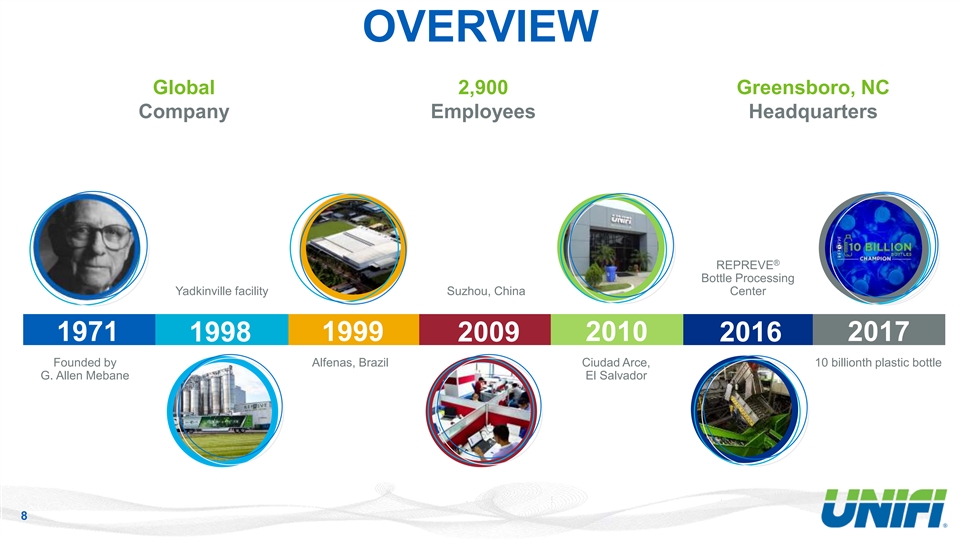
OVERVIEW Global 2,900 Greensboro, NC Company Employees Headquarters ® REPREVE Bottle Processing Yadkinville facility Suzhou, China Center 1971 1999 2010 2017 1998 2009 2016 Founded by Alfenas, Brazil Ciudad Arce, 10 billionth plastic bottle G. Allen Mebane El Salvador 8OVERVIEW Global 2,900 Greensboro, NC Company Employees Headquarters ® REPREVE Bottle Processing Yadkinville facility Suzhou, China Center 1971 1999 2010 2017 1998 2009 2016 Founded by Alfenas, Brazil Ciudad Arce, 10 billionth plastic bottle G. Allen Mebane El Salvador 8
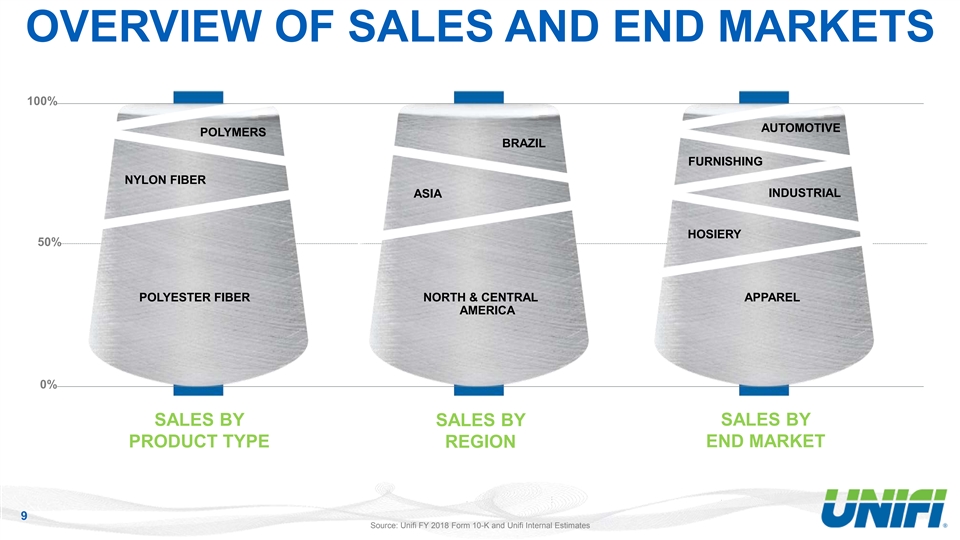
OVERVIEW OF SALES AND END MARKETS 100% AUTOMOTIVE POLYMERS BRAZIL FURNISHING NYLON FIBER INDUSTRIAL ASIA HOSIERY 50% POLYESTER FIBER NORTH & CENTRAL APPAREL AMERICA 0% SALES BY SALES BY SALES BY END MARKET PRODUCT TYPE REGION 9 Source: Unifi FY 2018 Form 10-K and Unifi Internal EstimatesOVERVIEW OF SALES AND END MARKETS 100% AUTOMOTIVE POLYMERS BRAZIL FURNISHING NYLON FIBER INDUSTRIAL ASIA HOSIERY 50% POLYESTER FIBER NORTH & CENTRAL APPAREL AMERICA 0% SALES BY SALES BY SALES BY END MARKET PRODUCT TYPE REGION 9 Source: Unifi FY 2018 Form 10-K and Unifi Internal Estimates

APPAREL VALUE CHAIN Consumer Mills Brands Retailers Feedback & Insights Recycled Materials Virgin Materials 10APPAREL VALUE CHAIN Consumer Mills Brands Retailers Feedback & Insights Recycled Materials Virgin Materials 10

UNIFI BRAND ARCHITECTURE PREMIUM VALUE-ADDED (PVA) ® REPREVE PROFIBER™ UNIFIBER™ The world’s #1 trusted brand of High-quality virgin fiber that is enhanced High-quality virgin fiber for cost- recycled performance fibers with performance benefits conscious designers and buyers 11UNIFI BRAND ARCHITECTURE PREMIUM VALUE-ADDED (PVA) ® REPREVE PROFIBER™ UNIFIBER™ The world’s #1 trusted brand of High-quality virgin fiber that is enhanced High-quality virgin fiber for cost- recycled performance fibers with performance benefits conscious designers and buyers 11

® REPREVE is a high-quality, performance fiber made from recycled materials. It’s an essential ingredient that makes products more earth-friendly. Many of the most recognizable, global brands use REPREVE. 12® REPREVE is a high-quality, performance fiber made from recycled materials. It’s an essential ingredient that makes products more earth-friendly. Many of the most recognizable, global brands use REPREVE. 12
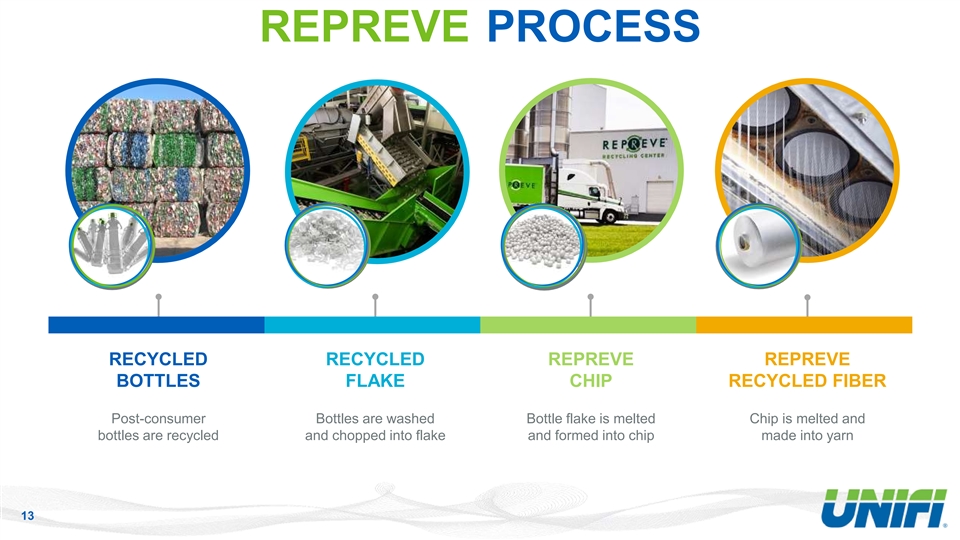
REPREVE PROCESS RECYCLED RECYCLED REPREVE REPREVE BOTTLES FLAKE CHIP RECYCLED FIBER Post-consumer Bottles are washed Bottle flake is melted Chip is melted and bottles are recycled and chopped into flake and formed into chip made into yarn 13REPREVE PROCESS RECYCLED RECYCLED REPREVE REPREVE BOTTLES FLAKE CHIP RECYCLED FIBER Post-consumer Bottles are washed Bottle flake is melted Chip is melted and bottles are recycled and chopped into flake and formed into chip made into yarn 13
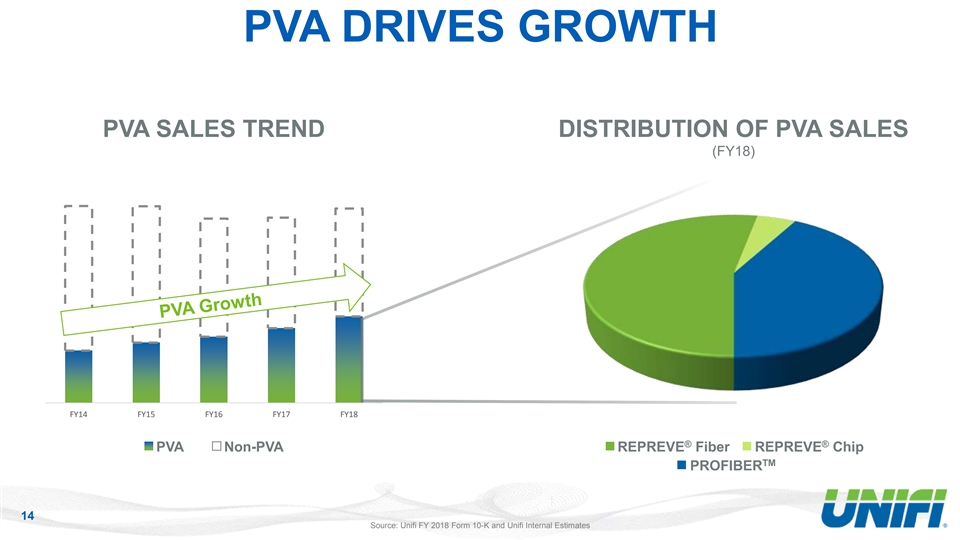
PVA DRIVES GROWTH PVA SALES TREND DISTRIBUTION OF PVA SALES (FY18) FY14 FY15 FY16 FY17 FY18 ® ® PVA Non-PVA REPREVE Fiber REPREVE Chip TM PROFIBER 14 Source: Unifi FY 2018 Form 10-K and Unifi Internal EstimatesPVA DRIVES GROWTH PVA SALES TREND DISTRIBUTION OF PVA SALES (FY18) FY14 FY15 FY16 FY17 FY18 ® ® PVA Non-PVA REPREVE Fiber REPREVE Chip TM PROFIBER 14 Source: Unifi FY 2018 Form 10-K and Unifi Internal Estimates
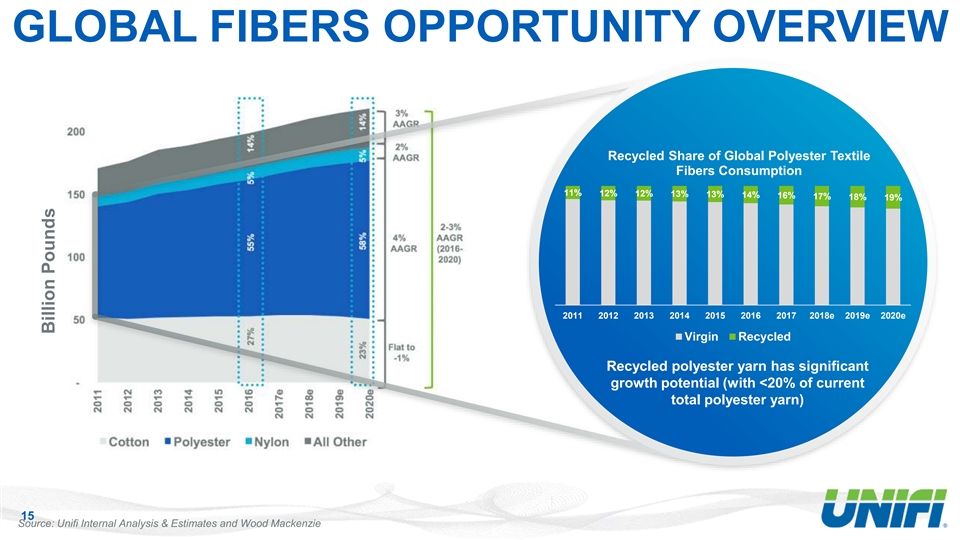
GLOBAL FIBERS OPPORTUNITY OVERVIEW Recycled Share of Global Polyester Textile Fibers Consumption 11% 12% 12% 13% 13% 14% 16% 17% 18% 19% 2011 2012 2013 2014 2015 2016 2017 2018e 2019e 2020e Virgin Recycled Recycled polyester yarn has significant growth potential (with <20% of current total polyester yarn) 15 Source: Unifi Internal Analysis & Estimates and Wood Mackenzie Billion PoundsGLOBAL FIBERS OPPORTUNITY OVERVIEW Recycled Share of Global Polyester Textile Fibers Consumption 11% 12% 12% 13% 13% 14% 16% 17% 18% 19% 2011 2012 2013 2014 2015 2016 2017 2018e 2019e 2020e Virgin Recycled Recycled polyester yarn has significant growth potential (with <20% of current total polyester yarn) 15 Source: Unifi Internal Analysis & Estimates and Wood Mackenzie Billion Pounds

“WHAT IF?” VIDEO 16“WHAT IF?” VIDEO 16

STRATEGY, KEY THEMES 3 Kevin Hall | Chairman and CEO 17STRATEGY, KEY THEMES 3 Kevin Hall | Chairman and CEO 17

vision Make everyday life better by transforming the world’s products through sustainable innovation. mission To be the world’s most sought-after performance and sustainability textile partner. 18vision Make everyday life better by transforming the world’s products through sustainable innovation. mission To be the world’s most sought-after performance and sustainability textile partner. 18

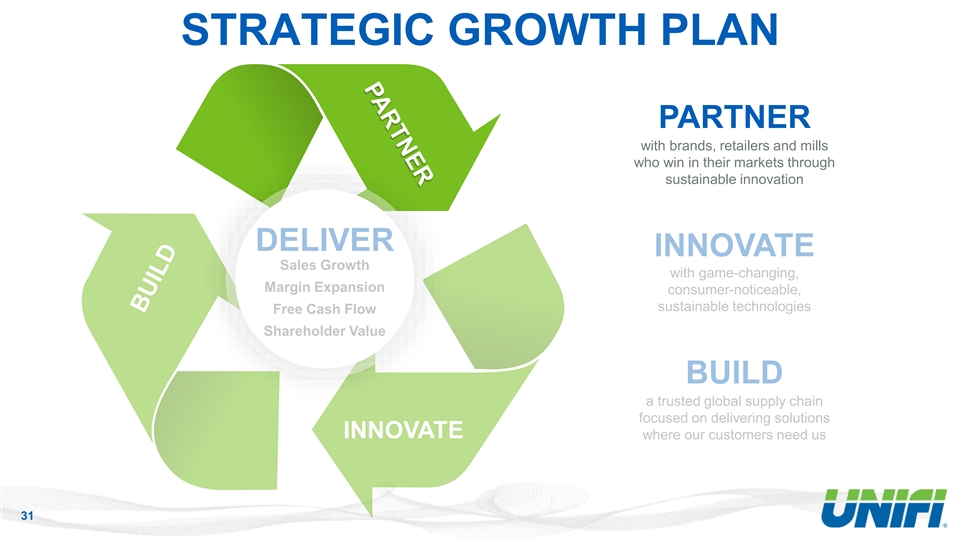
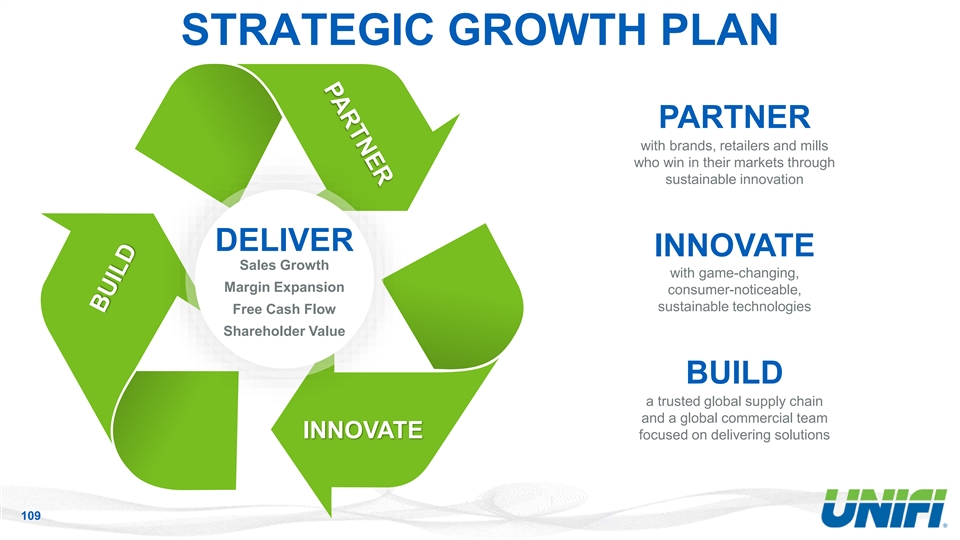
STRATEGIC GROWTH PLAN PARTNER with brands, retailers and mills who win in their markets through sustainable innovation DELIVER INNOVATE Sales Growth with game-changing, Margin Expansion consumer-noticeable, sustainable technologies Free Cash Flow Shareholder Value BUILD a trusted global supply chain focused on delivering solutions INNOVATE where our customers need us 19STRATEGIC GROWTH PLAN PARTNER with brands, retailers and mills who win in their markets through sustainable innovation DELIVER INNOVATE Sales Growth with game-changing, Margin Expansion consumer-noticeable, sustainable technologies Free Cash Flow Shareholder Value BUILD a trusted global supply chain focused on delivering solutions INNOVATE where our customers need us 19
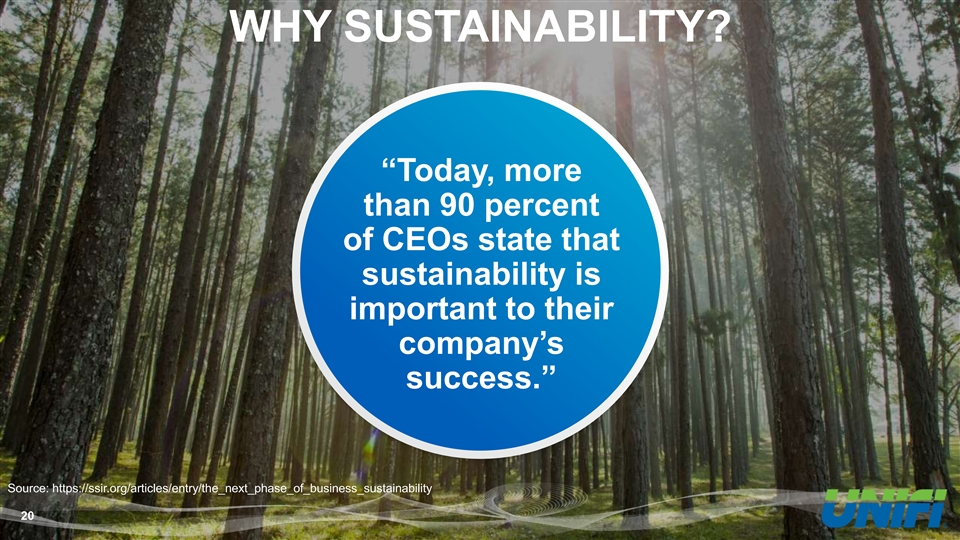
WHY SUSTAINABILITY? “Today, more than 90 percent of CEOs state that sustainability is important to their company’s success.” Source: https://ssir.org/articles/entry/the_next_phase_of_business_sustainability 20WHY SUSTAINABILITY? “Today, more than 90 percent of CEOs state that sustainability is important to their company’s success.” Source: https://ssir.org/articles/entry/the_next_phase_of_business_sustainability 20

IMPORTANCE OF SUSTAINABLE SOLUTIONS BOOMERS GEN X MILLENNIALS GEN Z 31% loyal to 31% have 47% socially and 55% understand boycotted non- producing sustainable environmentally sustainable sustainable products is most conscious criteria important companies businesses DEMANDS EXPECTS WANTS NICE TO HAVE SUSTAINABILITY SUSTAINABILITY SUSTAINABILITY SUSTAINABILITY 21 See Appendix for source detail. IMPORTANCE OF SUSTAINABLE SOLUTIONS BOOMERS GEN X MILLENNIALS GEN Z 31% loyal to 31% have 47% socially and 55% understand boycotted non- producing sustainable environmentally sustainable sustainable products is most conscious criteria important companies businesses DEMANDS EXPECTS WANTS NICE TO HAVE SUSTAINABILITY SUSTAINABILITY SUSTAINABILITY SUSTAINABILITY 21 See Appendix for source detail.

SUSTAINABILITY AND LEADING BRANDS “Commitments for 2030 include… “…we’re creating the future “reduce global environmental “…we’re committed to using designing all IKEA products with new we want to see through footprint by 50% by 2030” resources responsibly and circular principles, with the goal to only sustainable innovation.” designing our operations, Made for Change sustainability use renewable and recycled materials” products and services to be and responsibility strategy Mark Parker, President & CEO, sustainable and circular.” Nike, Inc. IKEA Facts and Figures 2018 Target Planet Report 2017 “…we are increasingly using “By 2030, 50% reduction in “…we are taking a circular materials that are more environmental footprint approach to how fashion is sustainable from a total life made and used.” Unilever Sustainable Living Plan cycle perspective…” Karl-Johan Persson, CEO Sustainability Report 2016-17 22SUSTAINABILITY AND LEADING BRANDS “Commitments for 2030 include… “…we’re creating the future “reduce global environmental “…we’re committed to using designing all IKEA products with new we want to see through footprint by 50% by 2030” resources responsibly and circular principles, with the goal to only sustainable innovation.” designing our operations, Made for Change sustainability use renewable and recycled materials” products and services to be and responsibility strategy Mark Parker, President & CEO, sustainable and circular.” Nike, Inc. IKEA Facts and Figures 2018 Target Planet Report 2017 “…we are increasingly using “By 2030, 50% reduction in “…we are taking a circular materials that are more environmental footprint approach to how fashion is sustainable from a total life made and used.” Unilever Sustainable Living Plan cycle perspective…” Karl-Johan Persson, CEO Sustainability Report 2016-17 22
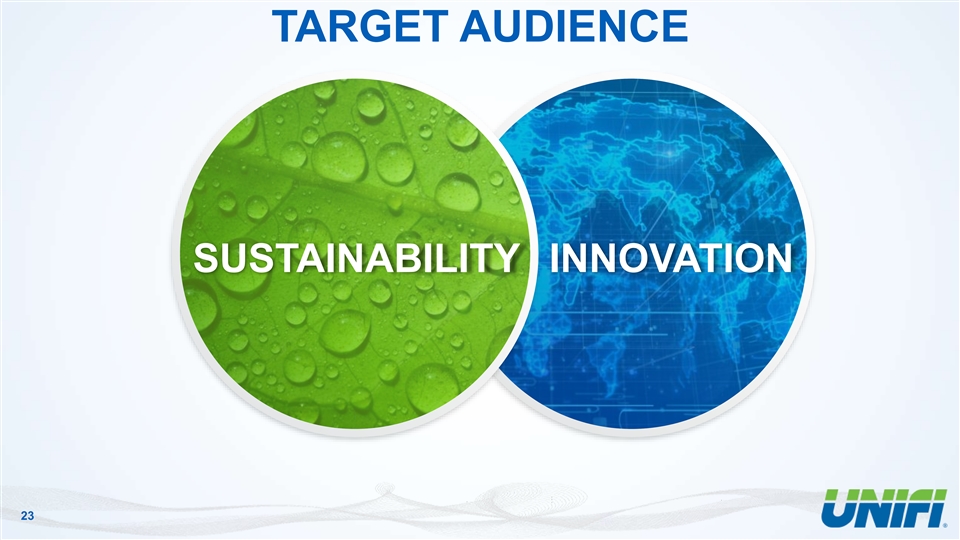
TARGET AUDIENCE SUSTAINABILITY INNOVATION 23TARGET AUDIENCE SUSTAINABILITY INNOVATION 23

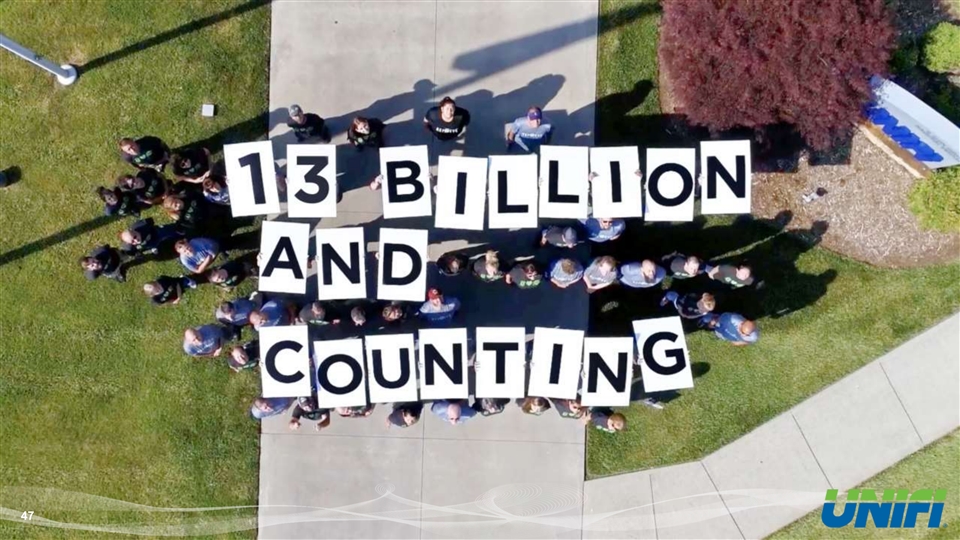
LEADING GLOBAL RECYCLED BRAND 10 BILLION IN 2017 20 BILLION BY 2020 30 BILLION BY 2022 24LEADING GLOBAL RECYCLED BRAND 10 BILLION IN 2017 20 BILLION BY 2020 30 BILLION BY 2022 24

REPREVE + INNOVATION Performance Comfort Touch / Feel Fashion Protection 25REPREVE + INNOVATION Performance Comfort Touch / Feel Fashion Protection 25
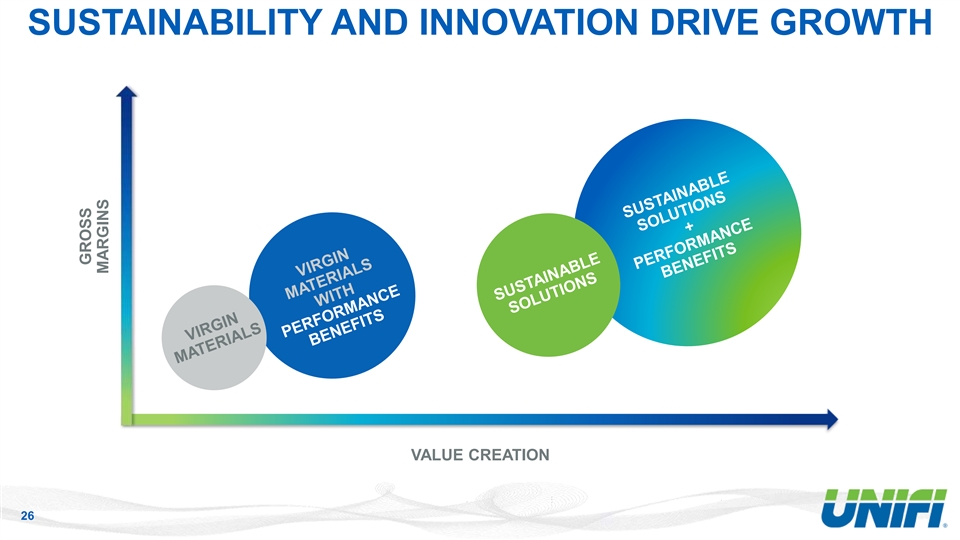
SUSTAINABILITY AND INNOVATION DRIVE GROWTH VALUE CREATION 26 GROSS MARGINSSUSTAINABILITY AND INNOVATION DRIVE GROWTH VALUE CREATION 26 GROSS MARGINS
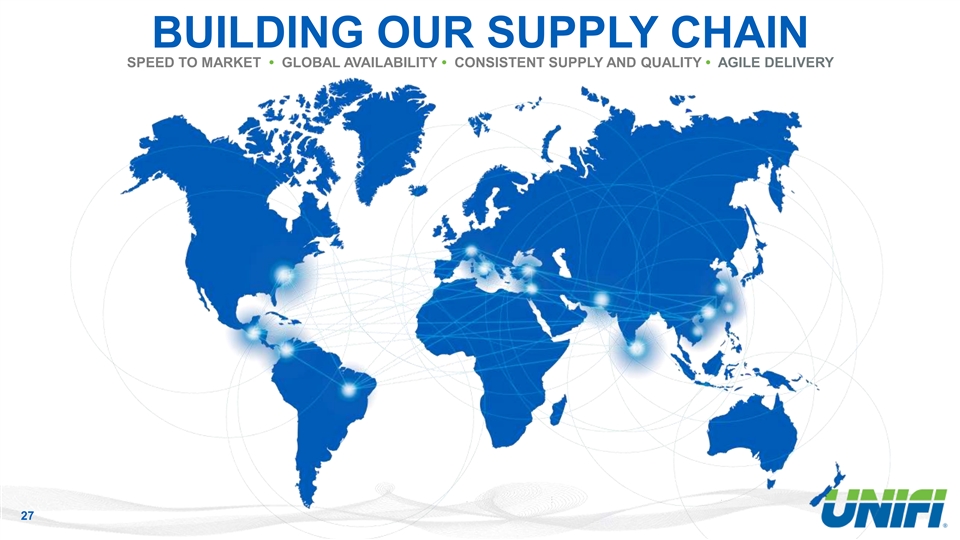
BUILDING OUR SUPPLY CHAIN SPEED TO MARKET • GLOBAL AVAILABILITY • CONSISTENT SUPPLY AND QUALITY • AGILE DELIVERY 27BUILDING OUR SUPPLY CHAIN SPEED TO MARKET • GLOBAL AVAILABILITY • CONSISTENT SUPPLY AND QUALITY • AGILE DELIVERY 27
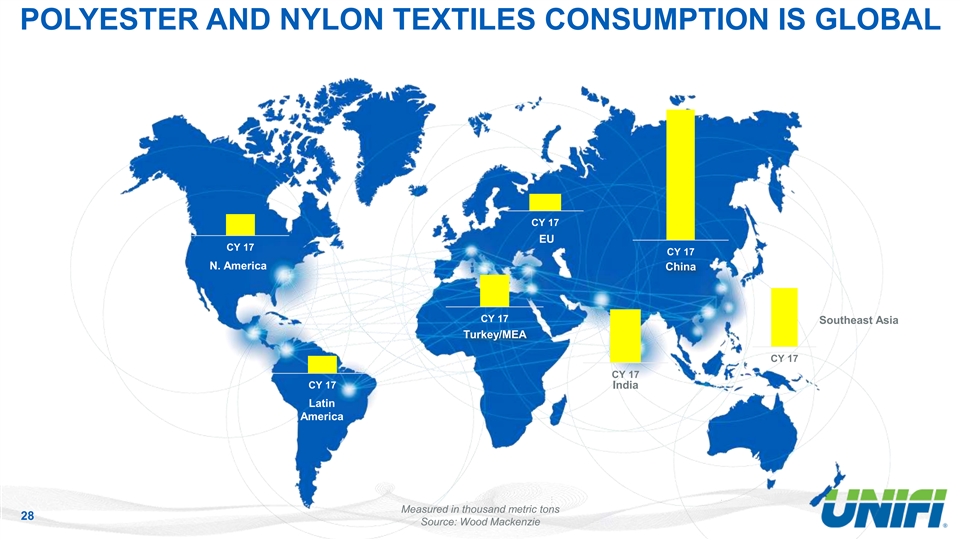
POLYESTER AND NYLON TEXTILES CONSUMPTION IS GLOBAL CY 17 EU CY 17 CY 17 N. America China CY 17 Southeast Asia Turkey/MEA CY 17 CY 17 CY 17 India Latin America Measured in thousand metric tons 28 Source: Wood MackenziePOLYESTER AND NYLON TEXTILES CONSUMPTION IS GLOBAL CY 17 EU CY 17 CY 17 N. America China CY 17 Southeast Asia Turkey/MEA CY 17 CY 17 CY 17 India Latin America Measured in thousand metric tons 28 Source: Wood Mackenzie
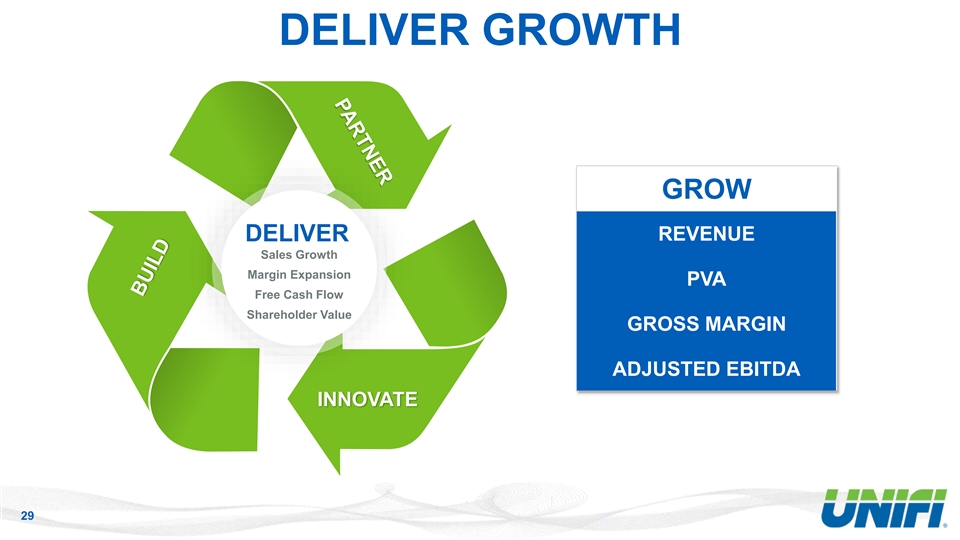
DELIVER GROWTH GROW DELIVER REVENUE Sales Growth Margin Expansion PVA Free Cash Flow Shareholder Value GROSS MARGIN ADJUSTED EBITDA INNOVATE 29DELIVER GROWTH GROW DELIVER REVENUE Sales Growth Margin Expansion PVA Free Cash Flow Shareholder Value GROSS MARGIN ADJUSTED EBITDA INNOVATE 29
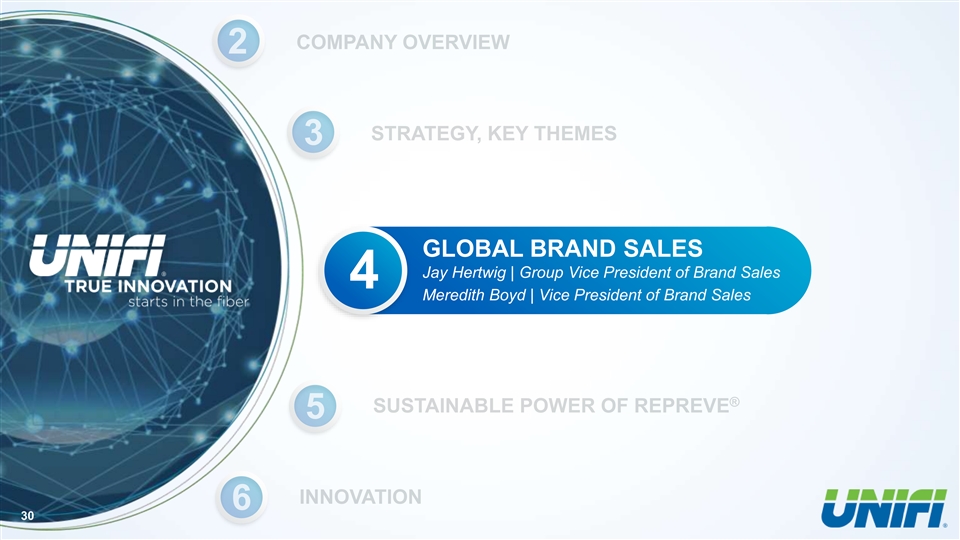
GLOBAL BRAND SALES Jay Hertwig | Group Vice President of Brand Sales 4 Meredith Boyd | Vice President of Brand Sales 30GLOBAL BRAND SALES Jay Hertwig | Group Vice President of Brand Sales 4 Meredith Boyd | Vice President of Brand Sales 30
STRATEGIC GROWTH PLAN PARTNER with brands, retailers and mills who win in their markets through sustainable innovation INNOVATE 31STRATEGIC GROWTH PLAN PARTNER with brands, retailers and mills who win in their markets through sustainable innovation INNOVATE 31

REPREVE BRAND GROWTH 32REPREVE BRAND GROWTH 32

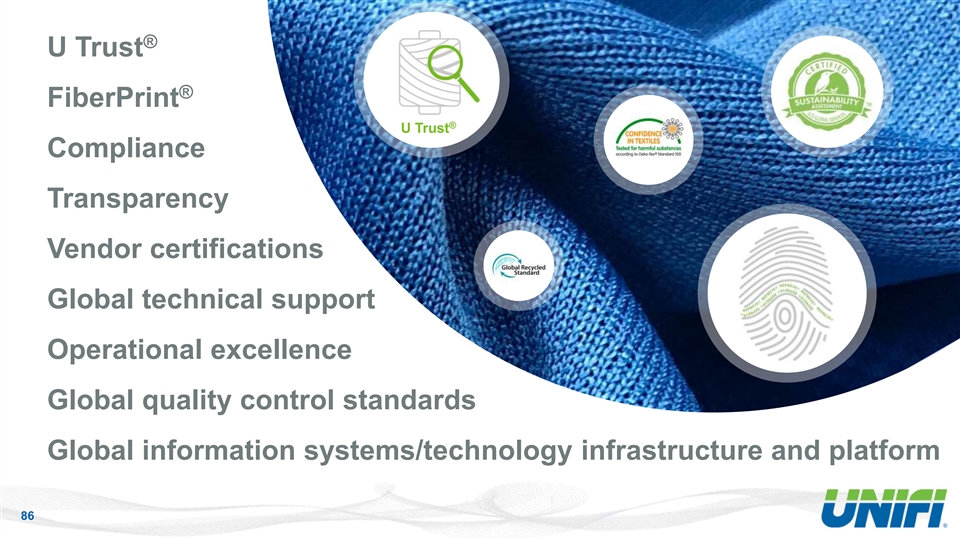
TRANSPARENT. TRACEABLE. CERTIFIED. U Trust Verification™ FiberPrint™ Technology Recycled Content ® The U Trust™ verification program is a FiberPrint™ technology helps customers Products made with REPREVE recycled comprehensive certification program designed avoid false environmental claims. This materials, including post-consumer plastic ® to provide REPREVE customers with a proprietary technology validates the bottles and pre-consumer fiber waste, are ® higher level of transparency. authenticity of REPREVE products, analyzes certified by third parties. the fabric content and composition to support third-party certifications. 33TRANSPARENT. TRACEABLE. CERTIFIED. U Trust Verification™ FiberPrint™ Technology Recycled Content ® The U Trust™ verification program is a FiberPrint™ technology helps customers Products made with REPREVE recycled comprehensive certification program designed avoid false environmental claims. This materials, including post-consumer plastic ® to provide REPREVE customers with a proprietary technology validates the bottles and pre-consumer fiber waste, are ® higher level of transparency. authenticity of REPREVE products, analyzes certified by third parties. the fabric content and composition to support third-party certifications. 33

UNIFI DIFFERENTIATION Unifi creates a push-pull scenario with its indirect and direct customer relationships, meeting consumer demands and customer needs throughout the supply chain, while driving sustainability and innovation throughout the product pipeline. >>> PUSH >>> engagement innovation customer service sustainability RETAILERS CONSUMERS partnership MILL PARTNERS BRANDS innovation (Direct Customers) (Indirect Customers) design sustainability <<< PULL <<< 34UNIFI DIFFERENTIATION Unifi creates a push-pull scenario with its indirect and direct customer relationships, meeting consumer demands and customer needs throughout the supply chain, while driving sustainability and innovation throughout the product pipeline. >>> PUSH >>> engagement innovation customer service sustainability RETAILERS CONSUMERS partnership MILL PARTNERS BRANDS innovation (Direct Customers) (Indirect Customers) design sustainability <<< PULL <<< 34
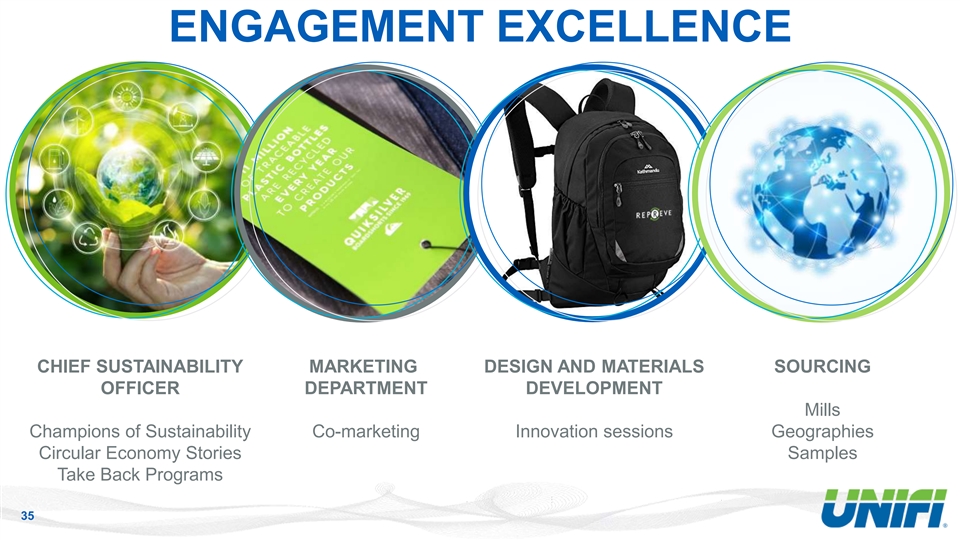
ENGAGEMENT EXCELLENCE CHIEF SUSTAINABILITY MARKETING DESIGN AND MATERIALS SOURCING OFFICER DEPARTMENT DEVELOPMENT Mills Champions of Sustainability Co-marketing Innovation sessions Geographies Circular Economy Stories Samples Take Back Programs 35ENGAGEMENT EXCELLENCE CHIEF SUSTAINABILITY MARKETING DESIGN AND MATERIALS SOURCING OFFICER DEPARTMENT DEVELOPMENT Mills Champions of Sustainability Co-marketing Innovation sessions Geographies Circular Economy Stories Samples Take Back Programs 35

CUSTOMER JOURNEY COLLABORATE LISTEN SOLVE SOURCE CO-MARKET LAUNCH Innovation Innovation Innovation Messaging Scale Consumer solution sessions production needs Claims Sampling Global Hangtags Source Sustainability Supply Chain goals Circular Development Sustainability Improve Economy Storytelling 36CUSTOMER JOURNEY COLLABORATE LISTEN SOLVE SOURCE CO-MARKET LAUNCH Innovation Innovation Innovation Messaging Scale Consumer solution sessions production needs Claims Sampling Global Hangtags Source Sustainability Supply Chain goals Circular Development Sustainability Improve Economy Storytelling 36

THE NORTH FACE BOTTLE SOURCE COLLECTION 37THE NORTH FACE BOTTLE SOURCE COLLECTION 37

PVA INNOVATION IN DENIM AT RETAIL 38PVA INNOVATION IN DENIM AT RETAIL 38
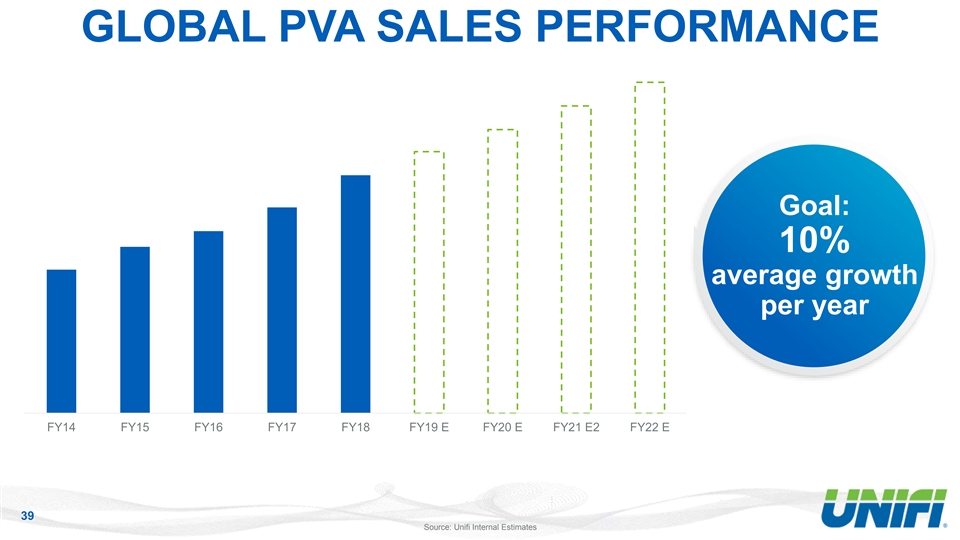
GLOBAL PVA SALES PERFORMANCE Goal: 10% average growth per year FY14 FY15 FY16 FY17 FY18 FY19 E FY20 E FY21 E2 FY22 E 39 Source: Unifi Internal EstimatesGLOBAL PVA SALES PERFORMANCE Goal: 10% average growth per year FY14 FY15 FY16 FY17 FY18 FY19 E FY20 E FY21 E2 FY22 E 39 Source: Unifi Internal Estimates
SUSTAINABLE POWER ® OF REPREVE 5 Helen Sahi | Vice President Global Sustainability 40SUSTAINABLE POWER ® OF REPREVE 5 Helen Sahi | Vice President Global Sustainability 40

SUSTAINABILITY: THE CASE 41SUSTAINABILITY: THE CASE 41
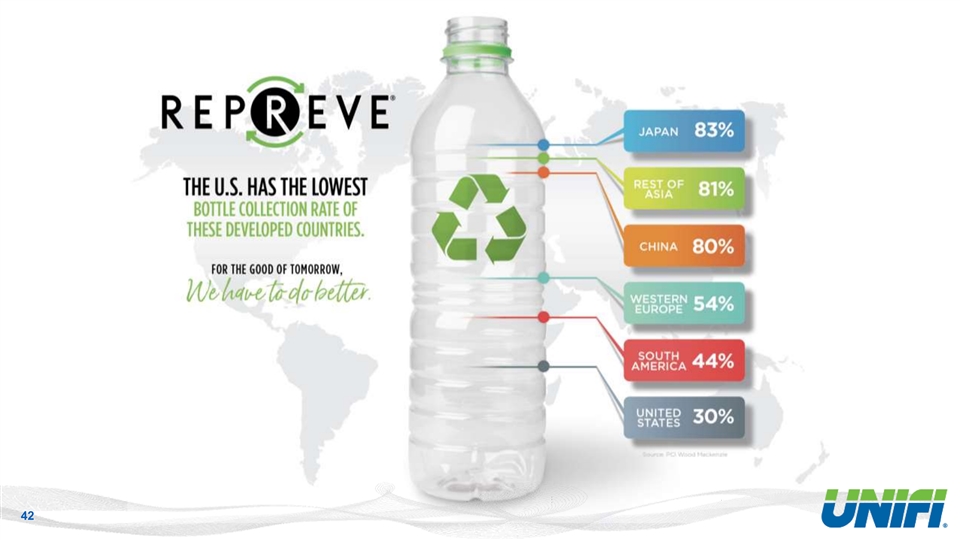
4242

SIGNIFICANT RECYCLING GOALS 30 BILLION BY 2022 43SIGNIFICANT RECYCLING GOALS 30 BILLION BY 2022 43

THE IMPACT OF 400,000 SHIRTS …generates …provides 600 … improves air enough energy to people their typical quality by avoiding power 50 homes daily drinking 130K kgs of CO 2 for 1 year water for 1 year emissions 44 Source: Unifi Internal EstimatesTHE IMPACT OF 400,000 SHIRTS …generates …provides 600 … improves air enough energy to people their typical quality by avoiding power 50 homes daily drinking 130K kgs of CO 2 for 1 year water for 1 year emissions 44 Source: Unifi Internal Estimates
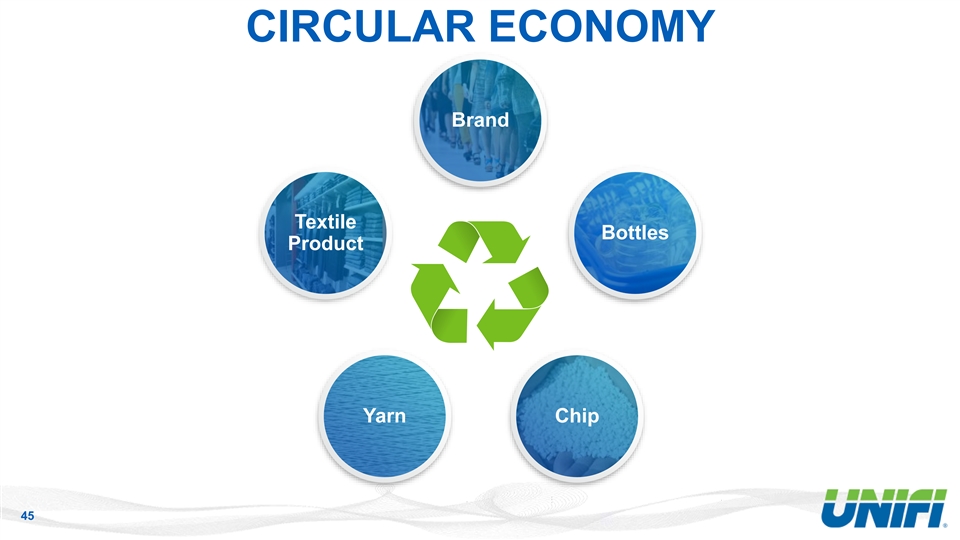
CIRCULAR ECONOMY Brand Textile Bottles Product Yarn Chip 45CIRCULAR ECONOMY Brand Textile Bottles Product Yarn Chip 45
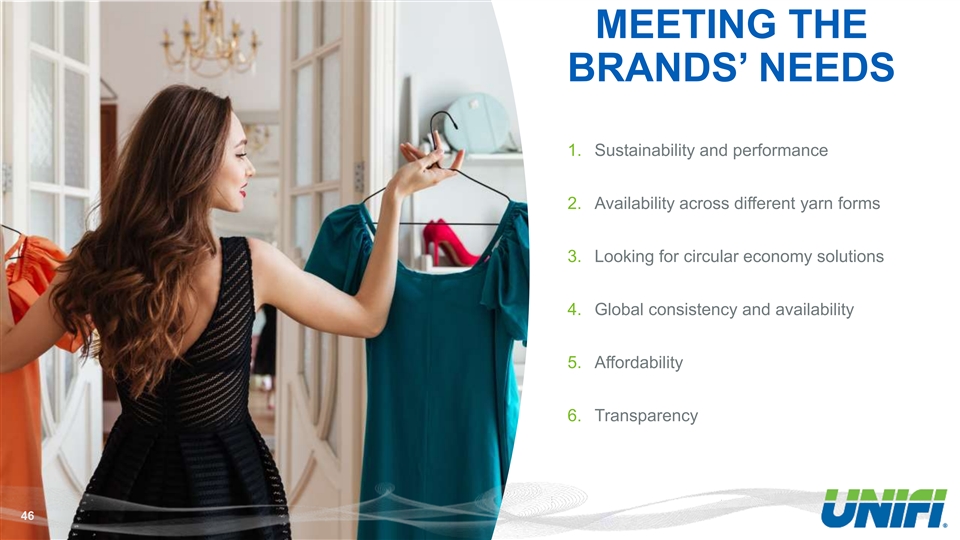
MEETING THE BRANDS’ NEEDS 1. Sustainability and performance 2. Availability across different yarn forms 3. Looking for circular economy solutions 4. Global consistency and availability 5. Affordability 6. Transparency 46MEETING THE BRANDS’ NEEDS 1. Sustainability and performance 2. Availability across different yarn forms 3. Looking for circular economy solutions 4. Global consistency and availability 5. Affordability 6. Transparency 46
4747
INNOVATION Richard Gerstein | EVP Branded PVA Business 6 and Global Chief Marketing and Innovation Officer 48INNOVATION Richard Gerstein | EVP Branded PVA Business 6 and Global Chief Marketing and Innovation Officer 48
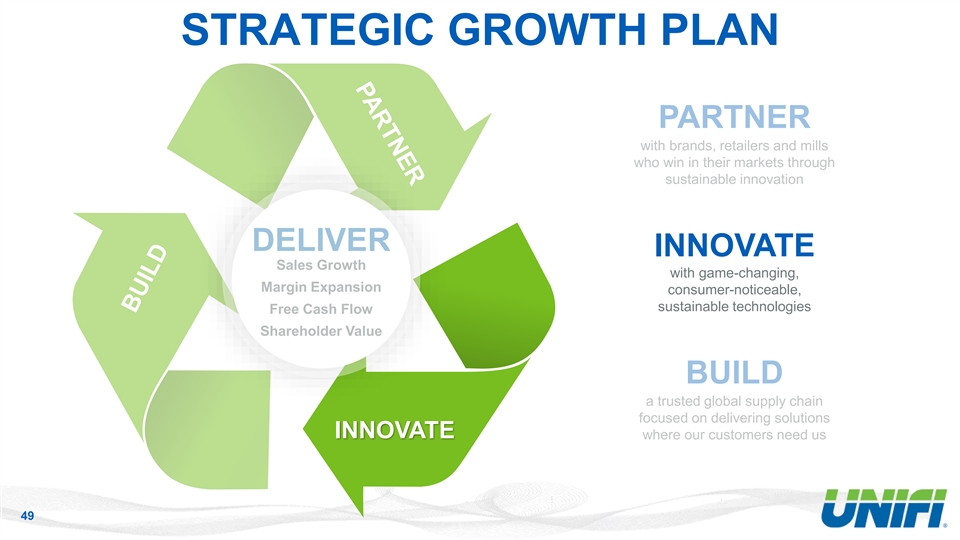
STRATEGIC GROWTH PLAN INNOVATE with game-changing, consumer-noticeable, sustainable technologies INNOVATE 49STRATEGIC GROWTH PLAN INNOVATE with game-changing, consumer-noticeable, sustainable technologies INNOVATE 49

UNIFI INNOVATION CAPABILITIES Polymer Mechanical Additives Finish Chemical Extrusion Finish 50UNIFI INNOVATION CAPABILITIES Polymer Mechanical Additives Finish Chemical Extrusion Finish 50
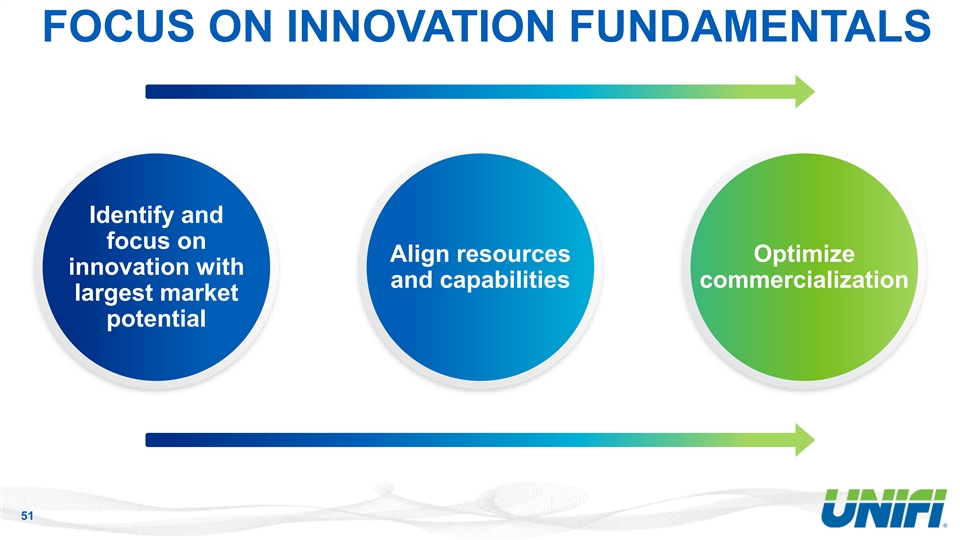
FOCUS ON INNOVATION FUNDAMENTALS Identify and focus on Align resources Optimize innovation with and capabilities commercialization largest market potential 51FOCUS ON INNOVATION FUNDAMENTALS Identify and focus on Align resources Optimize innovation with and capabilities commercialization largest market potential 51
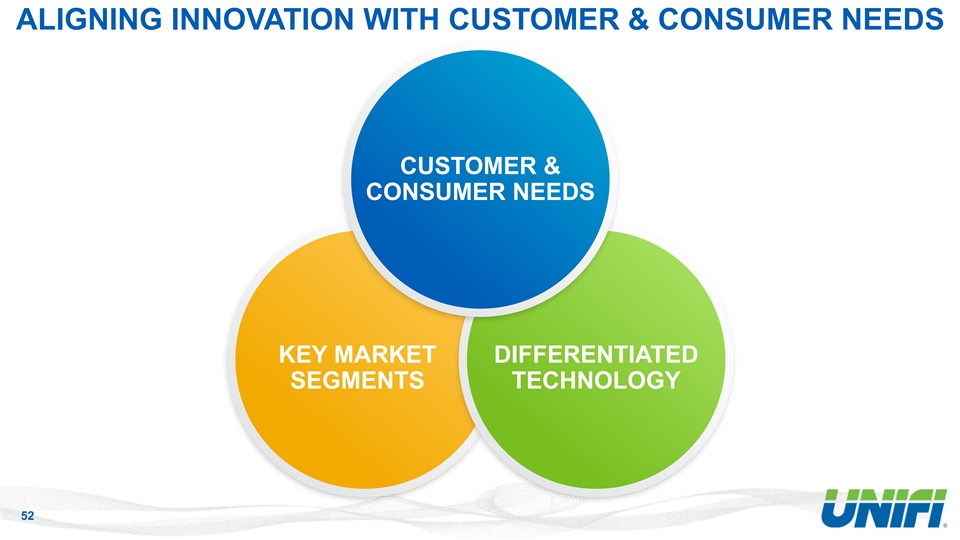
ALIGNING INNOVATION WITH CUSTOMER & CONSUMER NEEDS CUSTOMER & CONSUMER NEEDS KEY MARKET DIFFERENTIATED SEGMENTS TECHNOLOGY 52ALIGNING INNOVATION WITH CUSTOMER & CONSUMER NEEDS CUSTOMER & CONSUMER NEEDS KEY MARKET DIFFERENTIATED SEGMENTS TECHNOLOGY 52

CONSUMER NEEDS ACTIVE PERFORMANCE DESIGN & FIT PREVENTIVE PERFORMANCE Thermal Regulation • Odor Heathers • Fit • Color • Effects Durability • Flame Retardant • UV • Adaptive • Wicking • Cushioning 53CONSUMER NEEDS ACTIVE PERFORMANCE DESIGN & FIT PREVENTIVE PERFORMANCE Thermal Regulation • Odor Heathers • Fit • Color • Effects Durability • Flame Retardant • UV • Adaptive • Wicking • Cushioning 53
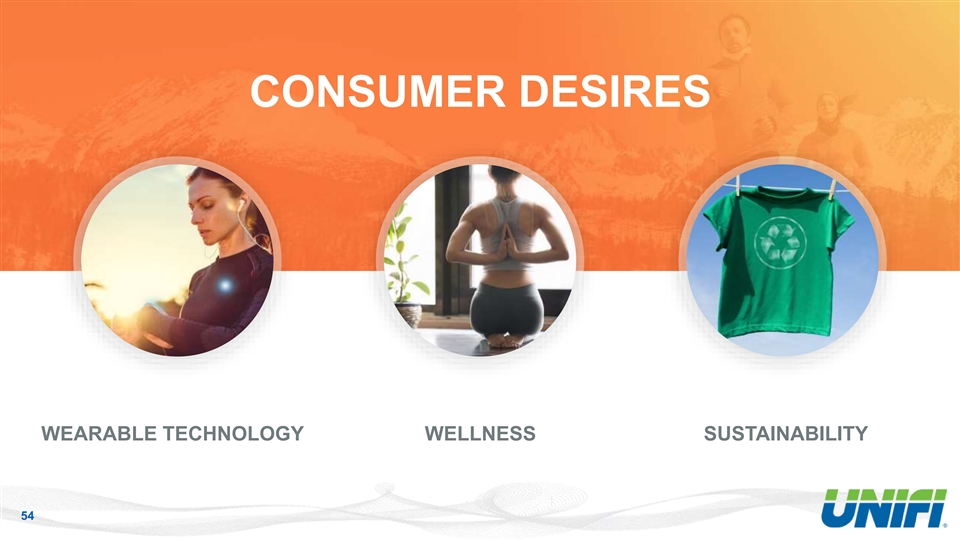
CONSUMER DESIRES WEARABLE TECHNOLOGY WELLNESS SUSTAINABILITY 54CONSUMER DESIRES WEARABLE TECHNOLOGY WELLNESS SUSTAINABILITY 54
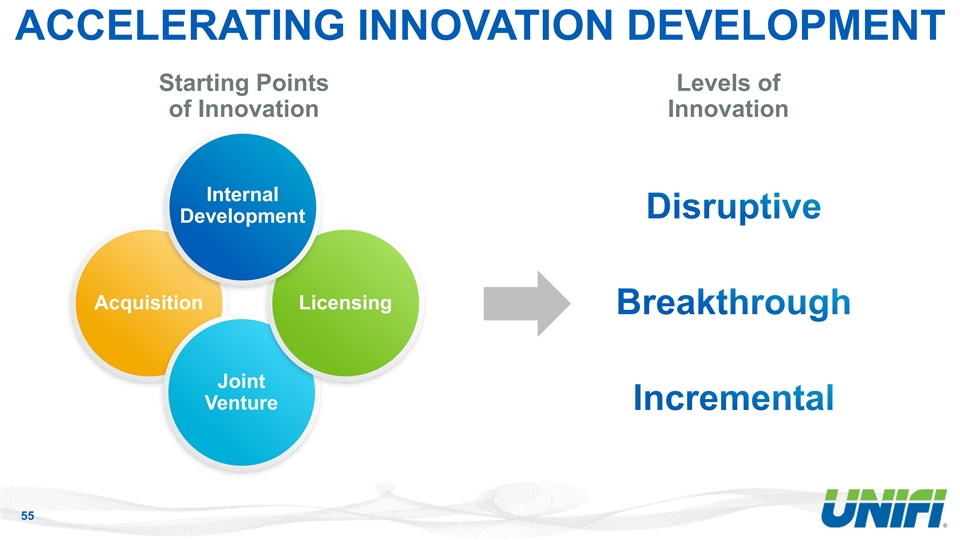
ACCELERATING INNOVATION DEVELOPMENT Starting Points Levels of of Innovation Innovation Internal Development Acquisition Licensing Joint Venture 55ACCELERATING INNOVATION DEVELOPMENT Starting Points Levels of of Innovation Innovation Internal Development Acquisition Licensing Joint Venture 55

DIFFERENTIATED PORTFOLIO SPECIALTY AND INDUSTRIAL PREMIUM VALUE ADDED UNIFIBER Value / Compliant Performance Sustainable + 56DIFFERENTIATED PORTFOLIO SPECIALTY AND INDUSTRIAL PREMIUM VALUE ADDED UNIFIBER Value / Compliant Performance Sustainable + 56

CASE STUDY SUSTAINABLE PERFORMANCE TECHNOLOGY IN SOCKS Stretch Wicking Engineered Reinforced Y Heel Targeted Compression performance for Wicking different applications Cushioning o Running o Hiking Antimicrobial o Work Cushioning o Sports Blister Protection Reinforced Seamless Toe 57CASE STUDY SUSTAINABLE PERFORMANCE TECHNOLOGY IN SOCKS Stretch Wicking Engineered Reinforced Y Heel Targeted Compression performance for Wicking different applications Cushioning o Running o Hiking Antimicrobial o Work Cushioning o Sports Blister Protection Reinforced Seamless Toe 57

CONSUMERS WANT COMFORT IN ALL APPLICATIONS MOISTURE WICKING and CUSHIONING are top benefits 58CONSUMERS WANT COMFORT IN ALL APPLICATIONS MOISTURE WICKING and CUSHIONING are top benefits 58

SUPERIOR PERFORMANCE FORCE REQUIRED FOR 25% VERTICAL WICKING* COMPRESSION** TIME REQUIRED PSI TO COMPRESS SOCK 30 5 5 25 4 4 20 3 15 3 2 10 2 1 5 1 0 0 Ours Competitor A Competitor B Competitor C Competitor D Unifi U Onif urs i Competitor A Competitor B Competitor C Competitor D Retails $14 Retails $19 Retails $14 Retails $8 Retails $14 Retails $19 Retails $14 Retails $8 The Ultimate Cushion Sock Athletic / Other Sport Hiking Sock Running Sock Work / Military Sock *AATCC Test Method 197 **ASTM D0156, modified 59 Time needed to wick 30cm (Min) psi SUPERIOR PERFORMANCE FORCE REQUIRED FOR 25% VERTICAL WICKING* COMPRESSION** TIME REQUIRED PSI TO COMPRESS SOCK 30 5 5 25 4 4 20 3 15 3 2 10 2 1 5 1 0 0 Ours Competitor A Competitor B Competitor C Competitor D Unifi U Onif urs i Competitor A Competitor B Competitor C Competitor D Retails $14 Retails $19 Retails $14 Retails $8 Retails $14 Retails $19 Retails $14 Retails $8 The Ultimate Cushion Sock Athletic / Other Sport Hiking Sock Running Sock Work / Military Sock *AATCC Test Method 197 **ASTM D0156, modified 59 Time needed to wick 30cm (Min) psi

UNDER ARMOUR CHARGED CUSHION SOCK BENEFITS: Sustainable Moisture Wicking Cushioning 60UNDER ARMOUR CHARGED CUSHION SOCK BENEFITS: Sustainable Moisture Wicking Cushioning 60

CUSTOMER INNOVATION CENTER 61CUSTOMER INNOVATION CENTER 61
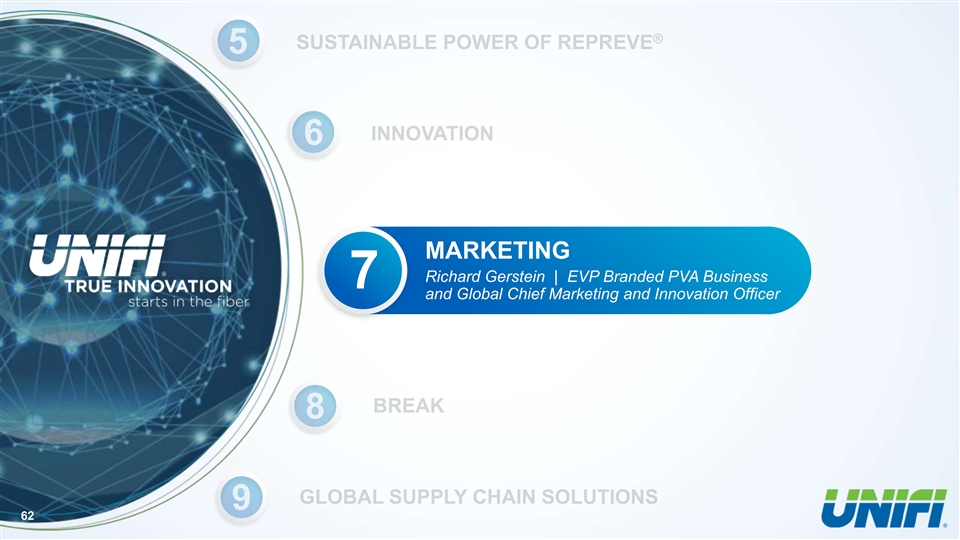
MARKETING Richard Gerstein | EVP Branded PVA Business 7 and Global Chief Marketing and Innovation Officer 62MARKETING Richard Gerstein | EVP Branded PVA Business 7 and Global Chief Marketing and Innovation Officer 62
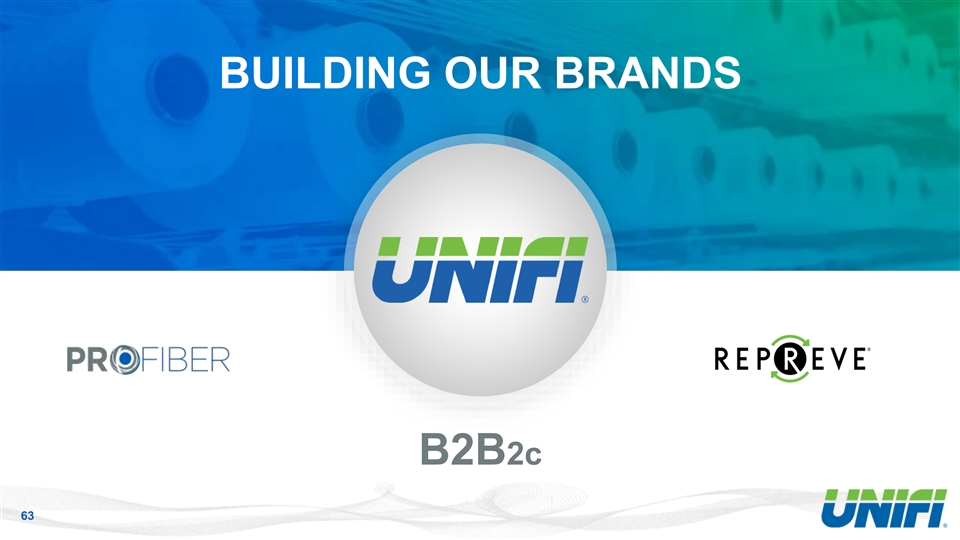
BUILDING OUR BRANDS B2B2c 63BUILDING OUR BRANDS B2B2c 63
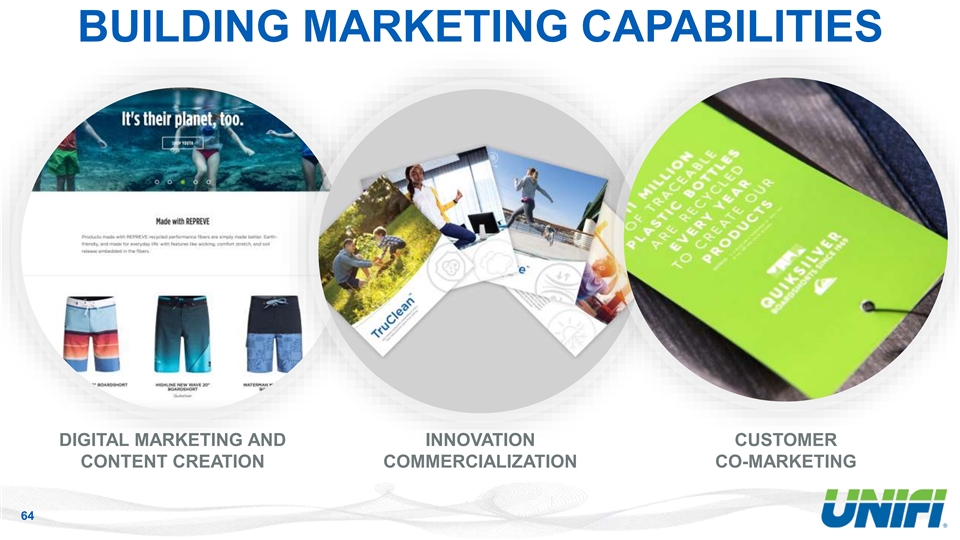
BUILDING MARKETING CAPABILITIES DIGITAL MARKETING AND INNOVATION CUSTOMER CONTENT CREATION COMMERCIALIZATION CO-MARKETING 64BUILDING MARKETING CAPABILITIES DIGITAL MARKETING AND INNOVATION CUSTOMER CONTENT CREATION COMMERCIALIZATION CO-MARKETING 64

TARGET AUDIENCE Leading Brands & Retailers Textile Mill Partners Consumers o Chief Sustainability Officers Employees o Chief Marketing Officers o Design and Innovation Teams o Supply Chain 65TARGET AUDIENCE Leading Brands & Retailers Textile Mill Partners Consumers o Chief Sustainability Officers Employees o Chief Marketing Officers o Design and Innovation Teams o Supply Chain 65
UNIFI BRAND ESSENCE True Innovation Starts in the Fiber 66UNIFI BRAND ESSENCE True Innovation Starts in the Fiber 66

“POSITIONING” VIDEO 67“POSITIONING” VIDEO 67
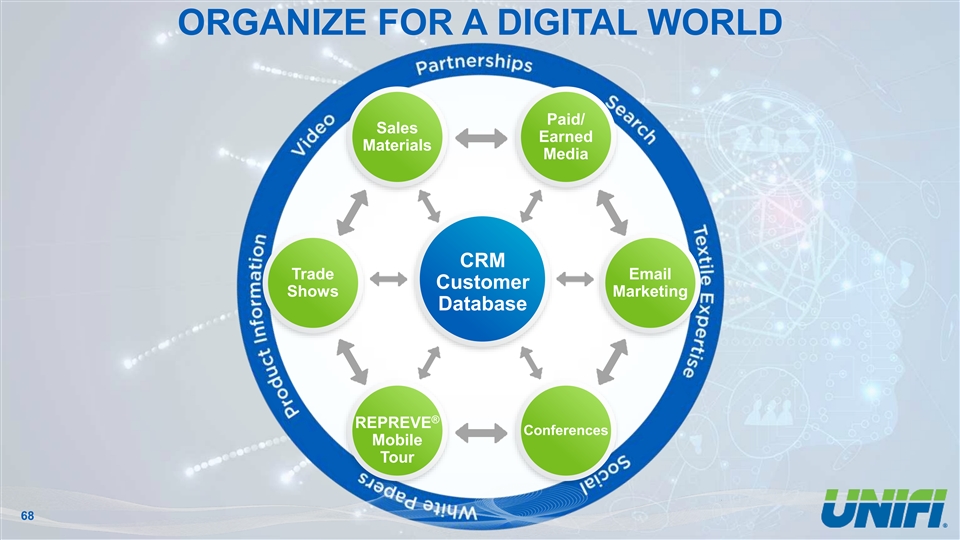
ORGANIZE FOR A DIGITAL WORLD Paid/ Sales Earned Materials Media CRM Trade Email Customer Shows Marketing Database ® REPREVE Conferences Mobile Tour 68ORGANIZE FOR A DIGITAL WORLD Paid/ Sales Earned Materials Media CRM Trade Email Customer Shows Marketing Database ® REPREVE Conferences Mobile Tour 68

DIGITAL ENGAGEMENT o 23% increase in monthly page views o 105% increase in time on site o 19% increase in organic search referral o Over 1,000 contact forms submitted o Over 380 product collateral downloads o Over 6,000 videos viewed Source: Google Analytics and Unifi Tracking. July – Sept 2018 vs April – June 2017 69DIGITAL ENGAGEMENT o 23% increase in monthly page views o 105% increase in time on site o 19% increase in organic search referral o Over 1,000 contact forms submitted o Over 380 product collateral downloads o Over 6,000 videos viewed Source: Google Analytics and Unifi Tracking. July – Sept 2018 vs April – June 2017 69

INNOVATION COMMERCIALIZATION MARKET FIRST SHIP / MARKETING INTELLIGENCE LAUNCH PLANS • Custom Data • Marketing Campaign • Customer Value • Market Data Begins Proposition • Customer Input • Sales Training • Lead Brand Partners (Presentations) • Messaging 70INNOVATION COMMERCIALIZATION MARKET FIRST SHIP / MARKETING INTELLIGENCE LAUNCH PLANS • Custom Data • Marketing Campaign • Customer Value • Market Data Begins Proposition • Customer Input • Sales Training • Lead Brand Partners (Presentations) • Messaging 70
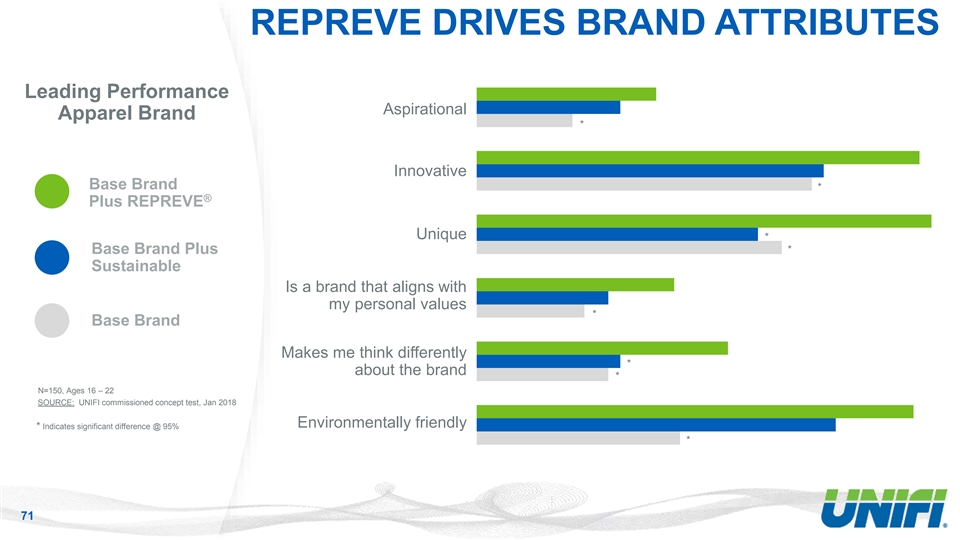
REPREVE DRIVES BRAND ATTRIBUTES Leading Performance Aspirational Apparel Brand * Innovative Base Brand * ® Plus REPREVE Unique * * Base Brand Plus Sustainable Is a brand that aligns with my personal values * Base Brand Makes me think differently * about the brand * N=150, Ages 16 – 22 SOURCE: UNIFI commissioned concept test, Jan 2018 Environmentally friendly Indicates significant difference @ 95% * * 71REPREVE DRIVES BRAND ATTRIBUTES Leading Performance Aspirational Apparel Brand * Innovative Base Brand * ® Plus REPREVE Unique * * Base Brand Plus Sustainable Is a brand that aligns with my personal values * Base Brand Makes me think differently * about the brand * N=150, Ages 16 – 22 SOURCE: UNIFI commissioned concept test, Jan 2018 Environmentally friendly Indicates significant difference @ 95% * * 71

CUSTOMER CO-MARKETING Build REPREVE as the gold standard in sustainable textile solutions Build preferred relationships with key stakeholders in brands and textile mills 100 175 18 MILLION REPREVE hang Customers Customer tours and tags distributed co-marketing innovation sessions in FY 2018 with Unifi each year (vs. 3 million in 2014) 72CUSTOMER CO-MARKETING Build REPREVE as the gold standard in sustainable textile solutions Build preferred relationships with key stakeholders in brands and textile mills 100 175 18 MILLION REPREVE hang Customers Customer tours and tags distributed co-marketing innovation sessions in FY 2018 with Unifi each year (vs. 3 million in 2014) 72
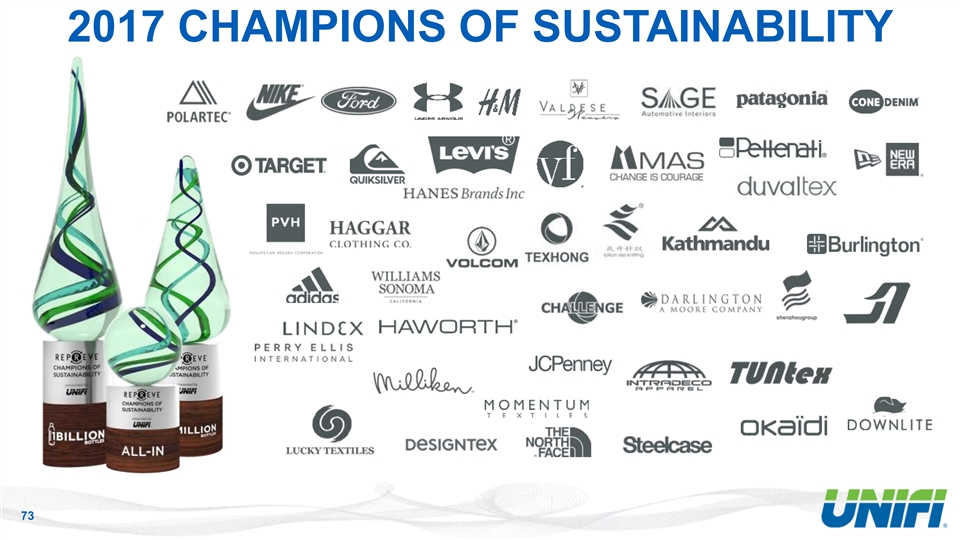
2017 CHAMPIONS OF SUSTAINABILITY 732017 CHAMPIONS OF SUSTAINABILITY 73
“CHAMPIONS OF SUSTAINABILITY” VIDEO 74“CHAMPIONS OF SUSTAINABILITY” VIDEO 74

WHAT IF? 75WHAT IF? 75
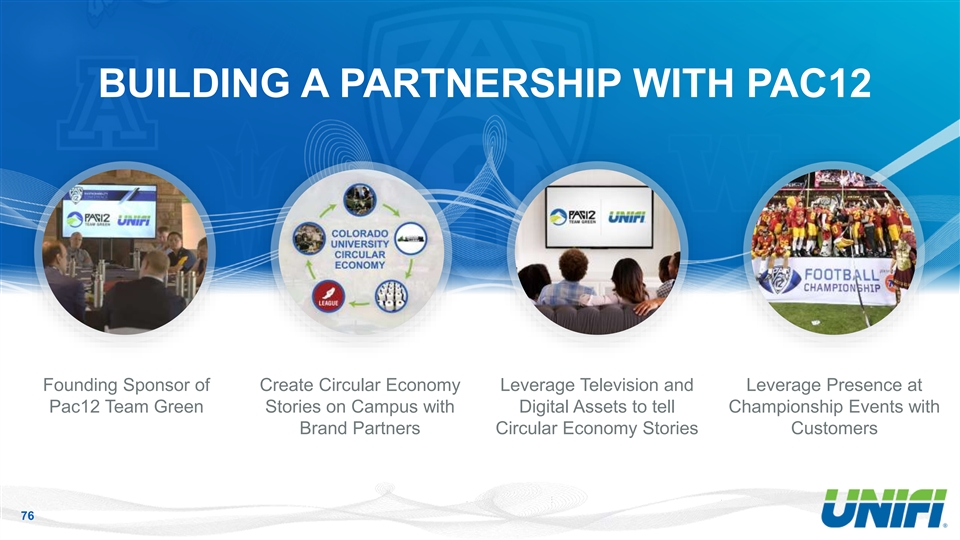
BUILDING A PARTNERSHIP WITH PAC12 Founding Sponsor of Create Circular Economy Leverage Television and Leverage Presence at Pac12 Team Green Stories on Campus with Digital Assets to tell Championship Events with Brand Partners Circular Economy Stories Customers 76BUILDING A PARTNERSHIP WITH PAC12 Founding Sponsor of Create Circular Economy Leverage Television and Leverage Presence at Pac12 Team Green Stories on Campus with Digital Assets to tell Championship Events with Brand Partners Circular Economy Stories Customers 76

“LEAGUE 91” VIDEO 77“LEAGUE 91” VIDEO 77

BREAK 8 15 Minutes 78BREAK 8 15 Minutes 78
GLOBAL SUPPLY CHAIN SOLUTIONS Tom Caudle | President and Chief Operating Officer 9 Sohan Mangaldas | Vice President of Supply Chain 79GLOBAL SUPPLY CHAIN SOLUTIONS Tom Caudle | President and Chief Operating Officer 9 Sohan Mangaldas | Vice President of Supply Chain 79

STRATEGIC GROWTH PLAN BUILD a trusted global supply chain focused on delivering solutions INNOVATE where our customers need us 80STRATEGIC GROWTH PLAN BUILD a trusted global supply chain focused on delivering solutions INNOVATE where our customers need us 80

BUILDING OUR SUPPLY CHAIN GLOBAL AVAILABILITY OF RECYCLED BRAND SPEED TO MARKET AND INNOVATIONS LOCAL FOR LOCAL ABILITY TO EASILY MOVE ACROSS REGIONS CONSISTENT SUPPLY QUALITY 81BUILDING OUR SUPPLY CHAIN GLOBAL AVAILABILITY OF RECYCLED BRAND SPEED TO MARKET AND INNOVATIONS LOCAL FOR LOCAL ABILITY TO EASILY MOVE ACROSS REGIONS CONSISTENT SUPPLY QUALITY 81
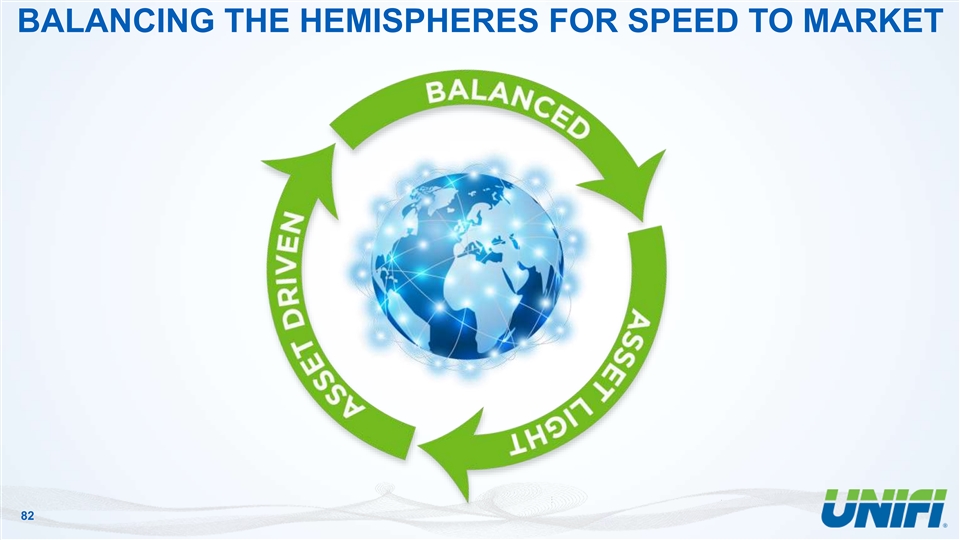
BALANCING THE HEMISPHERES FOR SPEED TO MARKET 82BALANCING THE HEMISPHERES FOR SPEED TO MARKET 82
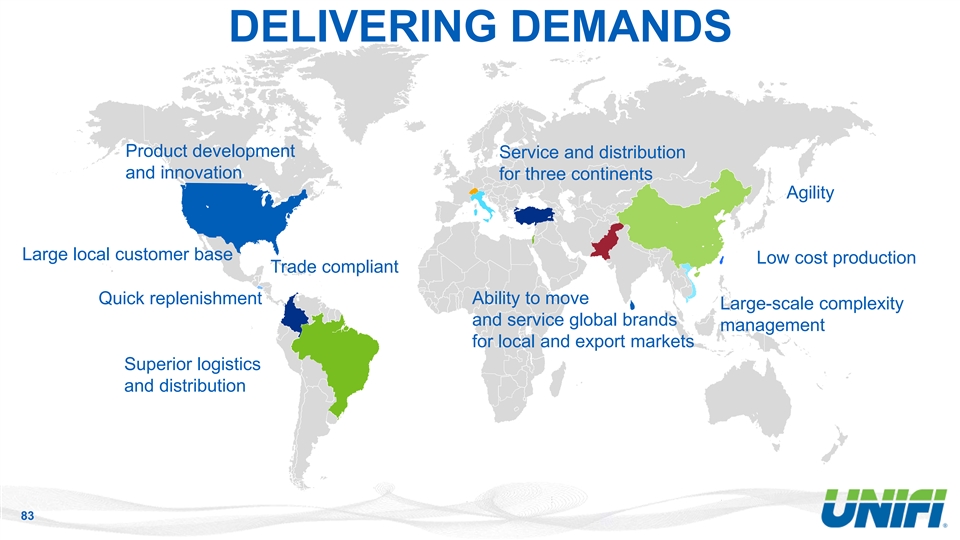
DELIVERING DEMANDS Product development Service and distribution and innovation for three continents Agility Large local customer base Low cost production Trade compliant Quick replenishment Ability to move Large-scale complexity and service global brands management for local and export markets Superior logistics and distribution 83DELIVERING DEMANDS Product development Service and distribution and innovation for three continents Agility Large local customer base Low cost production Trade compliant Quick replenishment Ability to move Large-scale complexity and service global brands management for local and export markets Superior logistics and distribution 83
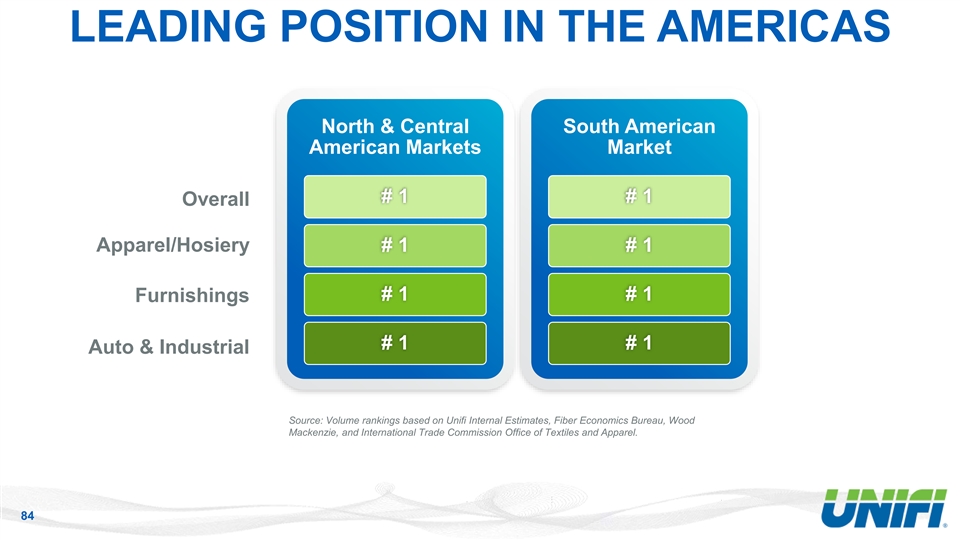
LEADING POSITION IN THE AMERICAS North & Central South American American Markets Market # 1 # 1 Overall Apparel/Hosiery # 1 # 1 # 1 # 1 Furnishings # 1 # 1 Auto & Industrial Source: Volume rankings based on Unifi Internal Estimates, Fiber Economics Bureau, Wood Mackenzie, and International Trade Commission Office of Textiles and Apparel. 84LEADING POSITION IN THE AMERICAS North & Central South American American Markets Market # 1 # 1 Overall Apparel/Hosiery # 1 # 1 # 1 # 1 Furnishings # 1 # 1 Auto & Industrial Source: Volume rankings based on Unifi Internal Estimates, Fiber Economics Bureau, Wood Mackenzie, and International Trade Commission Office of Textiles and Apparel. 84
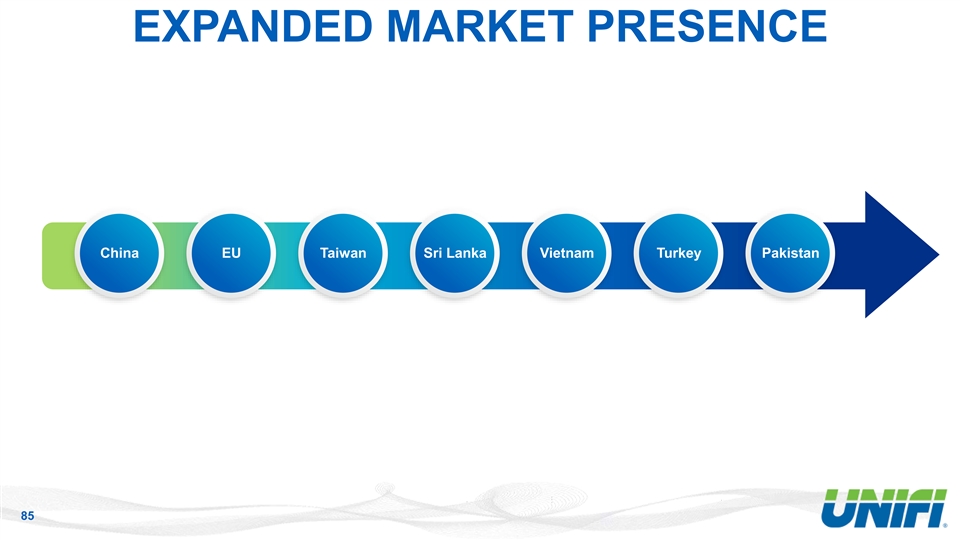
EXPANDED MARKET PRESENCE China EU Taiwan Sri Lanka Vietnam Turkey Pakistan 85EXPANDED MARKET PRESENCE China EU Taiwan Sri Lanka Vietnam Turkey Pakistan 85
® U Trust ® FiberPrint ® U Trust Compliance Transparency Vendor certifications Global technical support Operational excellence Global quality control standards Global information systems/technology infrastructure and platform 86® U Trust ® FiberPrint ® U Trust Compliance Transparency Vendor certifications Global technical support Operational excellence Global quality control standards Global information systems/technology infrastructure and platform 86

CASE STUDY: ASIA 10 Hongjun Ning | Vice President Asia, Europe, Africa 87CASE STUDY: ASIA 10 Hongjun Ning | Vice President Asia, Europe, Africa 87
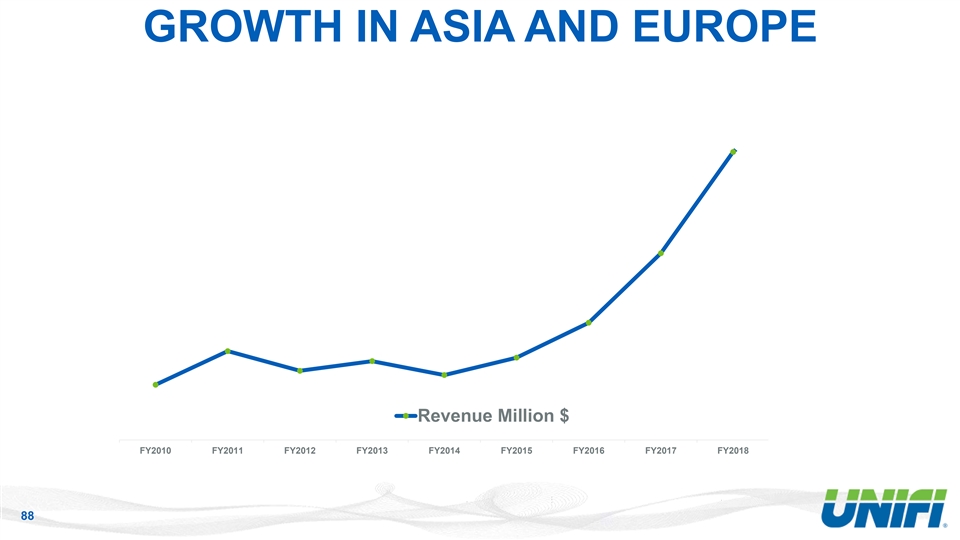
GROWTH IN ASIA AND EUROPE Revenue Million $ FY2010 FY2011 FY2012 FY2013 FY2014 FY2015 FY2016 FY2017 FY2018 FY2019 Budget 88GROWTH IN ASIA AND EUROPE Revenue Million $ FY2010 FY2011 FY2012 FY2013 FY2014 FY2015 FY2016 FY2017 FY2018 FY2019 Budget 88
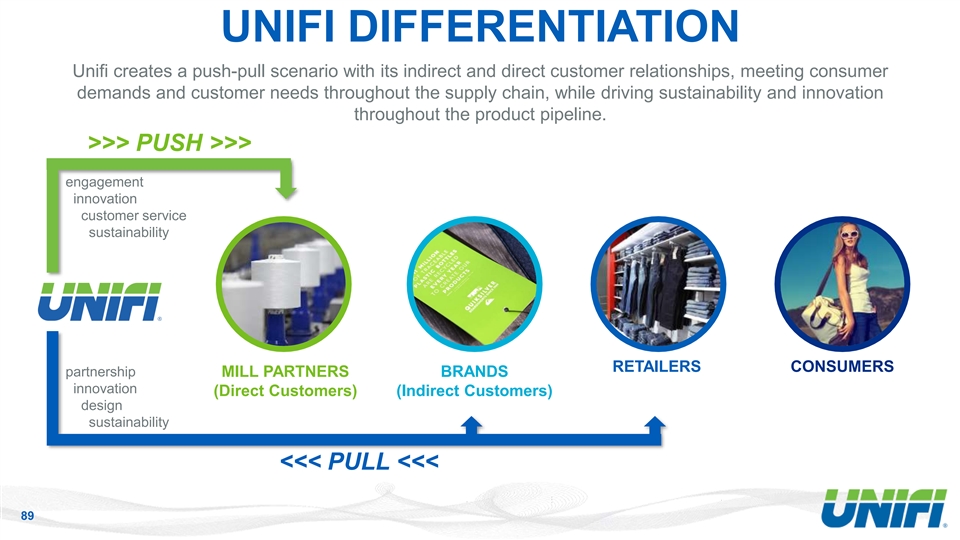
UNIFI DIFFERENTIATION Unifi creates a push-pull scenario with its indirect and direct customer relationships, meeting consumer demands and customer needs throughout the supply chain, while driving sustainability and innovation throughout the product pipeline. >>> PUSH >>> engagement innovation customer service sustainability RETAILERS CONSUMERS partnership MILL PARTNERS BRANDS innovation (Direct Customers) (Indirect Customers) design sustainability <<< PULL <<< 89UNIFI DIFFERENTIATION Unifi creates a push-pull scenario with its indirect and direct customer relationships, meeting consumer demands and customer needs throughout the supply chain, while driving sustainability and innovation throughout the product pipeline. >>> PUSH >>> engagement innovation customer service sustainability RETAILERS CONSUMERS partnership MILL PARTNERS BRANDS innovation (Direct Customers) (Indirect Customers) design sustainability <<< PULL <<< 89
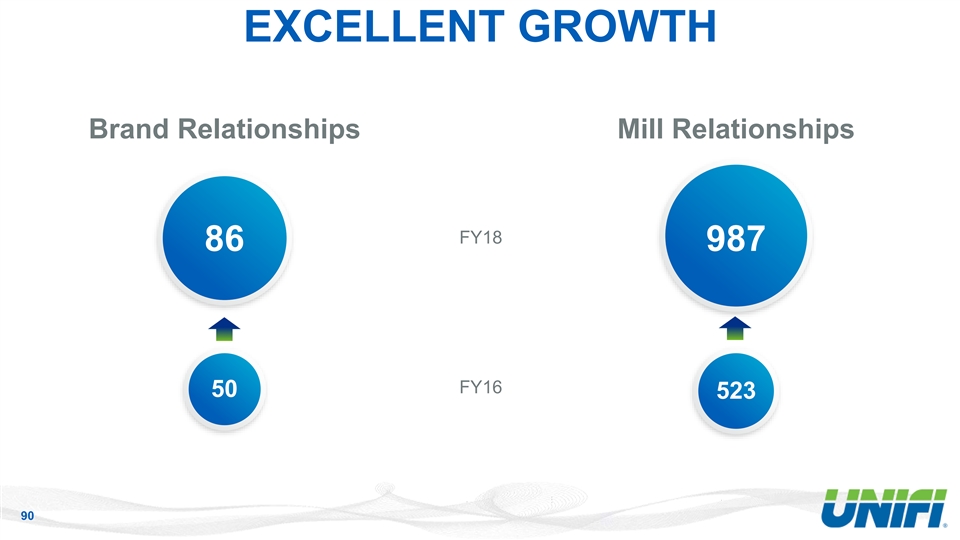
EXCELLENT GROWTH Brand Relationships Mill Relationships FY18 86 987 FY16 50 523 90EXCELLENT GROWTH Brand Relationships Mill Relationships FY18 86 987 FY16 50 523 90
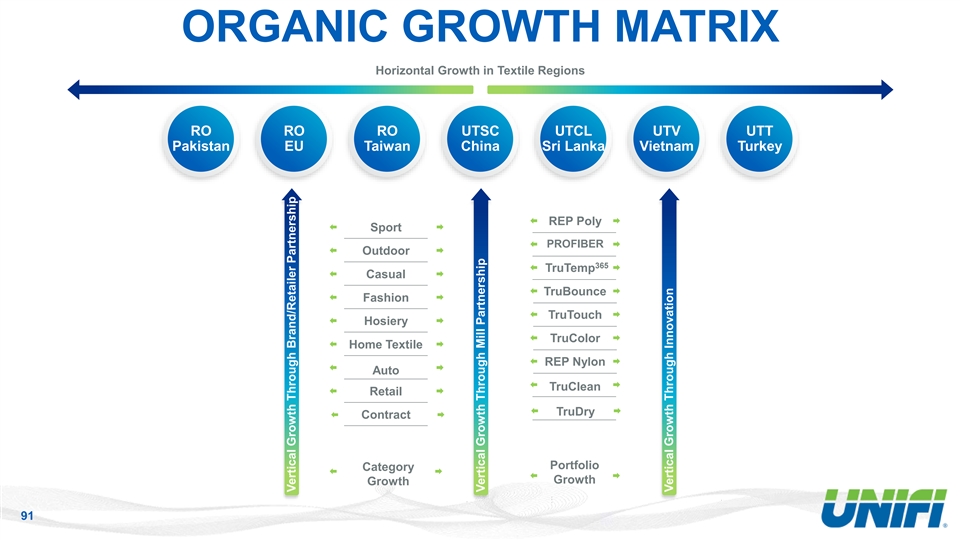
ORGANIC GROWTH MATRIX Horizontal Growth in Textile Regions RO RO RO UTSC UTCL UTV UTT Pakistan EU Taiwan China Sri Lanka Vietnam Turkey REP Poly Sport PROFIBER Outdoor 365 TruTemp Casual TruBounce Fashion TruTouch Hosiery TruColor Home Textile REP Nylon Auto TruClean Retail TruDry Contract Portfolio Category Growth Growth 91 Vertical Growth Through Brand/Retailer Partnership Vertical Growth Through Mill Partnership Vertical Growth Through InnovationORGANIC GROWTH MATRIX Horizontal Growth in Textile Regions RO RO RO UTSC UTCL UTV UTT Pakistan EU Taiwan China Sri Lanka Vietnam Turkey REP Poly Sport PROFIBER Outdoor 365 TruTemp Casual TruBounce Fashion TruTouch Hosiery TruColor Home Textile REP Nylon Auto TruClean Retail TruDry Contract Portfolio Category Growth Growth 91 Vertical Growth Through Brand/Retailer Partnership Vertical Growth Through Mill Partnership Vertical Growth Through Innovation
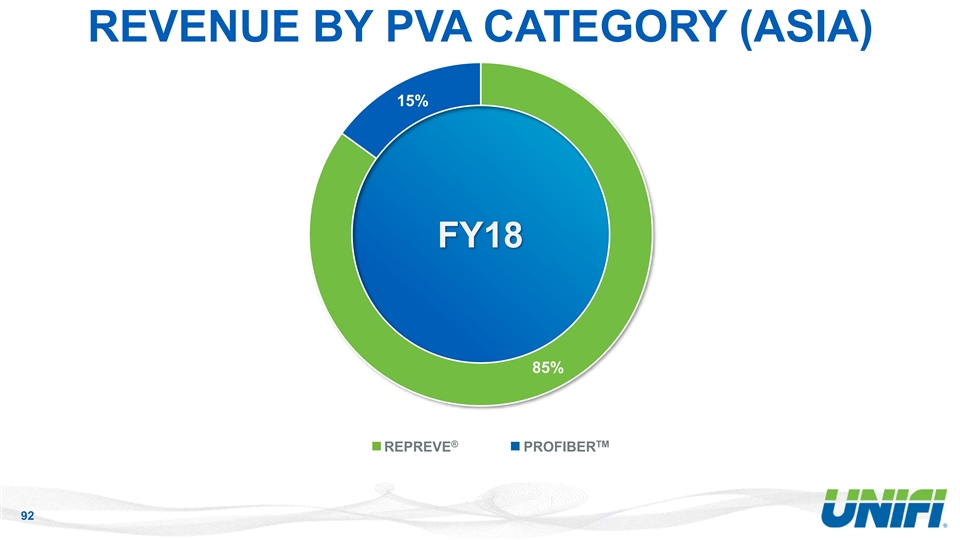
REVENUE BY PVA CATEGORY (ASIA) 15% FY18 85% ® TM REPREVE PROFIBER 92REVENUE BY PVA CATEGORY (ASIA) 15% FY18 85% ® TM REPREVE PROFIBER 92

INTERTEXTILE SHOW 18 - SHANGHAI 93INTERTEXTILE SHOW 18 - SHANGHAI 93
FINANCIAL OVERVIEW Jeff Ackerman | Executive Vice President 11 and Chief Financial Officer 94FINANCIAL OVERVIEW Jeff Ackerman | Executive Vice President 11 and Chief Financial Officer 94

STRATEGIC GROWTH PLAN PARTNER with brands, retailers and mills who win in their markets through sustainable innovation DELIVER INNOVATE Sales Growth with game-changing, Margin Expansion consumer-noticeable, sustainable technologies Free Cash Flow Shareholder Value BUILD a trusted global supply chain focused on delivering solutions INNOVATE where our customers need us 95STRATEGIC GROWTH PLAN PARTNER with brands, retailers and mills who win in their markets through sustainable innovation DELIVER INNOVATE Sales Growth with game-changing, Margin Expansion consumer-noticeable, sustainable technologies Free Cash Flow Shareholder Value BUILD a trusted global supply chain focused on delivering solutions INNOVATE where our customers need us 95
DELIVER SHAREHOLDER RETURNS Sales Growth Profit Growth Free Cash Flow 96DELIVER SHAREHOLDER RETURNS Sales Growth Profit Growth Free Cash Flow 96
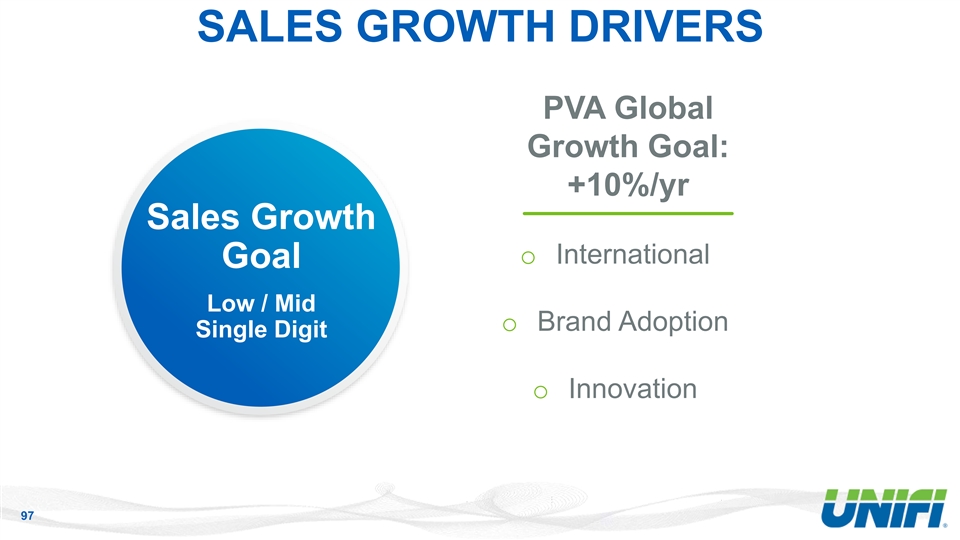
SALES GROWTH DRIVERS PVA Global Growth Goal: +10%/yr Sales Growth o International Goal Low / Mid o Brand Adoption Single Digit o Innovation 97SALES GROWTH DRIVERS PVA Global Growth Goal: +10%/yr Sales Growth o International Goal Low / Mid o Brand Adoption Single Digit o Innovation 97
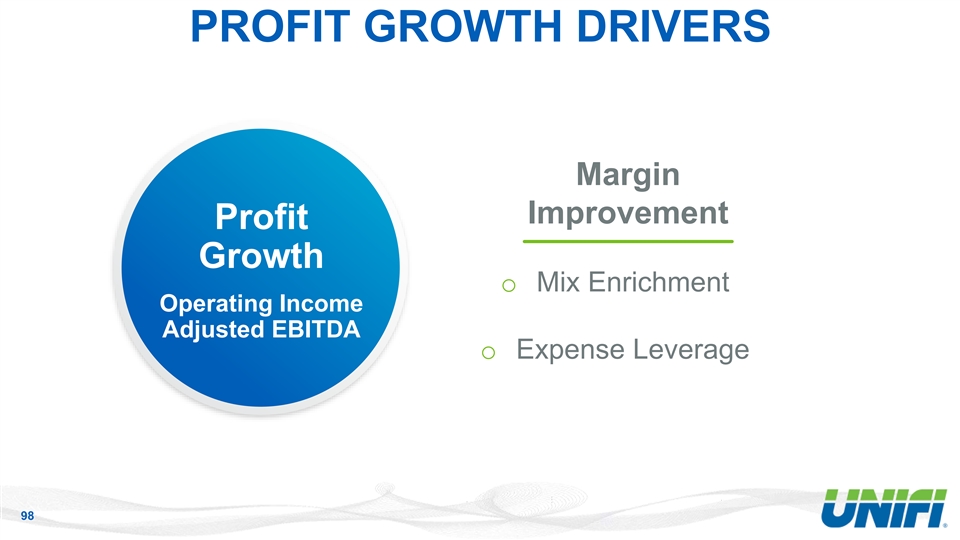
PROFIT GROWTH DRIVERS Margin Improvement Profit Growth o Mix Enrichment Operating Income Adjusted EBITDA o Expense Leverage 98PROFIT GROWTH DRIVERS Margin Improvement Profit Growth o Mix Enrichment Operating Income Adjusted EBITDA o Expense Leverage 98
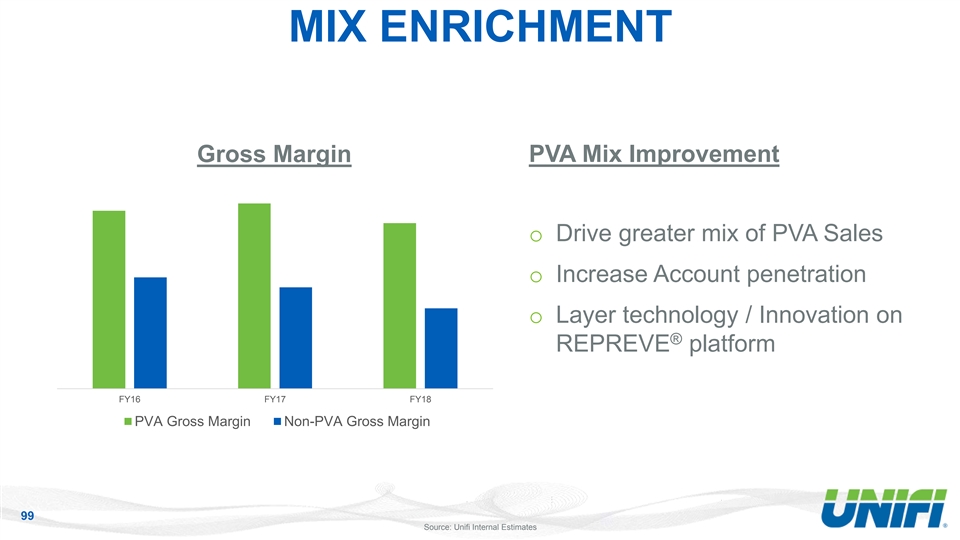
MIX ENRICHMENT Gross Margin PVA Mix Improvement o Drive greater mix of PVA Sales o Increase Account penetration o Layer technology / Innovation on ® REPREVE platform FY16 FY17 FY18 PVA Gross Margin Non-PVA Gross Margin 99 Source: Unifi Internal EstimatesMIX ENRICHMENT Gross Margin PVA Mix Improvement o Drive greater mix of PVA Sales o Increase Account penetration o Layer technology / Innovation on ® REPREVE platform FY16 FY17 FY18 PVA Gross Margin Non-PVA Gross Margin 99 Source: Unifi Internal Estimates
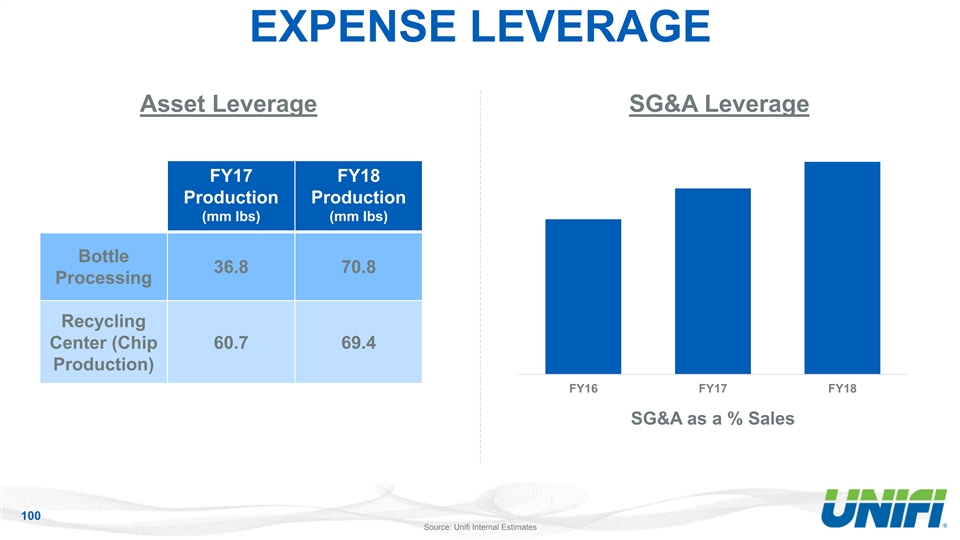
EXPENSE LEVERAGE Asset Leverage SG&A Leverage FY17 FY18 Production Production (mm lbs) (mm lbs) Bottle 36.8 70.8 Processing Recycling Center (Chip 60.7 69.4 Production) FY16 FY17 FY18 SG&A as a % Sales 100 Source: Unifi Internal EstimatesEXPENSE LEVERAGE Asset Leverage SG&A Leverage FY17 FY18 Production Production (mm lbs) (mm lbs) Bottle 36.8 70.8 Processing Recycling Center (Chip 60.7 69.4 Production) FY16 FY17 FY18 SG&A as a % Sales 100 Source: Unifi Internal Estimates
FREE CASH FLOW DRIVERS Working Capital Free Cash Flow Capital Expenditures 101FREE CASH FLOW DRIVERS Working Capital Free Cash Flow Capital Expenditures 101
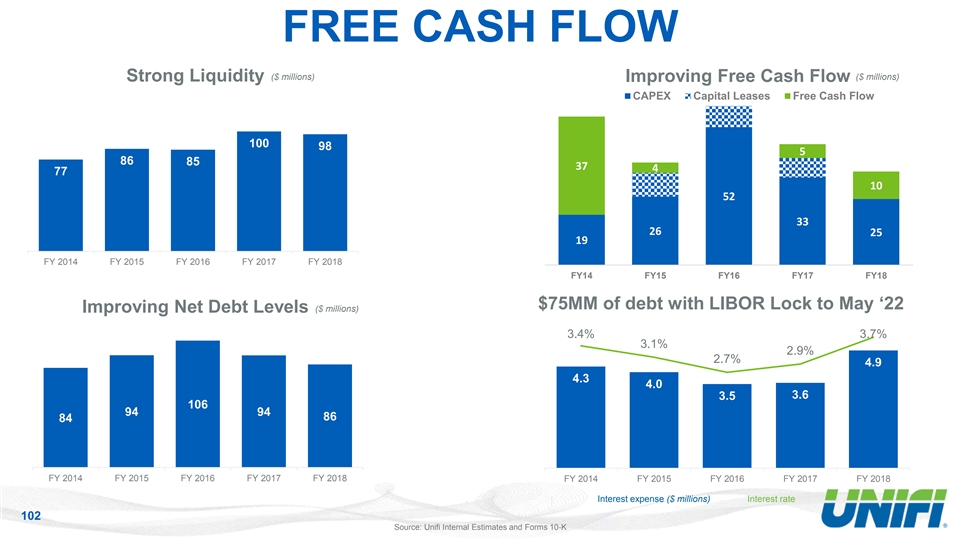
FREE CASH FLOW ($ millions) ($ millions) Strong Liquidity Improving Free Cash Flow CAPEX Capital Leases Free Cash Flow 100 98 5 86 85 37 4 77 10 52 33 26 25 19 FY 2014 FY 2015 FY 2016 FY 2017 FY 2018 FY14 FY15 FY16 FY17 FY18 $75MM of debt with LIBOR Lock to May ‘22 ($ millions) Improving Net Debt Levels 3.4% 3.7% 3.1% 2.9% 2.7% 4.9 4.3 4.0 3.6 3.5 106 94 94 86 84 FY 2014 FY 2015 FY 2016 FY 2017 FY 2018 FY 2014 FY 2015 FY 2016 FY 2017 FY 2018 Interest expense ($ millions) Interest rate 102 Source: Unifi Internal Estimates and Forms 10-KFREE CASH FLOW ($ millions) ($ millions) Strong Liquidity Improving Free Cash Flow CAPEX Capital Leases Free Cash Flow 100 98 5 86 85 37 4 77 10 52 33 26 25 19 FY 2014 FY 2015 FY 2016 FY 2017 FY 2018 FY14 FY15 FY16 FY17 FY18 $75MM of debt with LIBOR Lock to May ‘22 ($ millions) Improving Net Debt Levels 3.4% 3.7% 3.1% 2.9% 2.7% 4.9 4.3 4.0 3.6 3.5 106 94 94 86 84 FY 2014 FY 2015 FY 2016 FY 2017 FY 2018 FY 2014 FY 2015 FY 2016 FY 2017 FY 2018 Interest expense ($ millions) Interest rate 102 Source: Unifi Internal Estimates and Forms 10-K
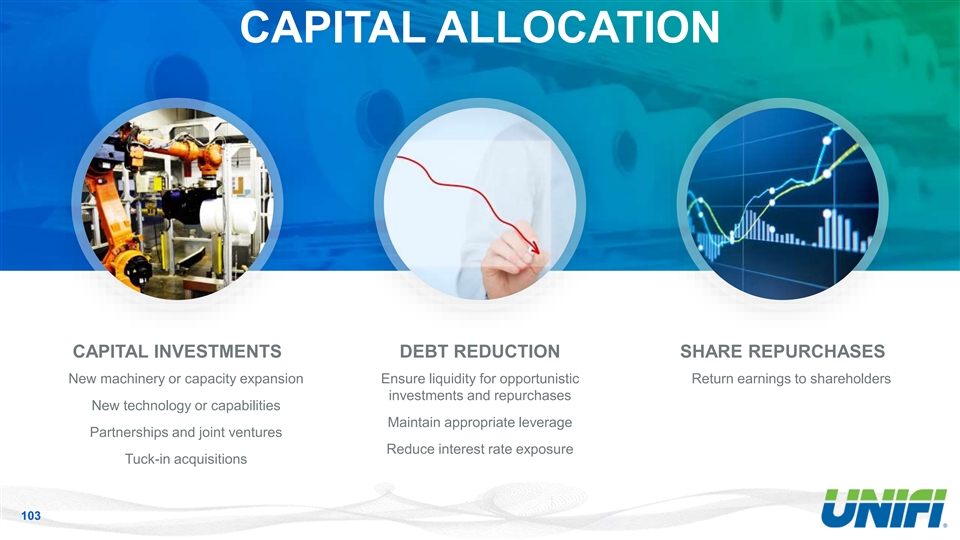
CAPITAL ALLOCATION CAPITAL INVESTMENTS DEBT REDUCTION SHARE REPURCHASES New machinery or capacity expansion Ensure liquidity for opportunistic Return earnings to shareholders investments and repurchases New technology or capabilities Maintain appropriate leverage Partnerships and joint ventures Reduce interest rate exposure Tuck-in acquisitions 103CAPITAL ALLOCATION CAPITAL INVESTMENTS DEBT REDUCTION SHARE REPURCHASES New machinery or capacity expansion Ensure liquidity for opportunistic Return earnings to shareholders investments and repurchases New technology or capabilities Maintain appropriate leverage Partnerships and joint ventures Reduce interest rate exposure Tuck-in acquisitions 103

FUTURE FINANCIAL GOALS Goal Revenue Growth LSD - MSD PVA Sales Growth 10% (1) Adjusted EBITDA Growth Exceed Sales Growth Capital Expenditures Current Trends (1) Adjusted EBITDA is a non-GAAP financial measure further detailed on slide 4. 104FUTURE FINANCIAL GOALS Goal Revenue Growth LSD - MSD PVA Sales Growth 10% (1) Adjusted EBITDA Growth Exceed Sales Growth Capital Expenditures Current Trends (1) Adjusted EBITDA is a non-GAAP financial measure further detailed on slide 4. 104

OIL AND PET USUALLY MOVE IN SYNC o Over time, PET costs track generally with Crude Oil o PET costs can be impacted by supply and demand dynamics specific to feedstocks (PX, MEG, PTA) o PET costs can also be impacted by substitutes (i.e. cotton) 105 Source: Wood MackenzieOIL AND PET USUALLY MOVE IN SYNC o Over time, PET costs track generally with Crude Oil o PET costs can be impacted by supply and demand dynamics specific to feedstocks (PX, MEG, PTA) o PET costs can also be impacted by substitutes (i.e. cotton) 105 Source: Wood Mackenzie
PET COSTS IMPACT GROSS MARGIN o 80% of UFI sales are PET-based o Pricing lags raw material cost changes by 1-2 quarters o Over time, we expect raw material cost is neutral to gross margin o Revenues will rise more quickly in a rising cost environment, and may trend downward in a declining cost environment 106PET COSTS IMPACT GROSS MARGIN o 80% of UFI sales are PET-based o Pricing lags raw material cost changes by 1-2 quarters o Over time, we expect raw material cost is neutral to gross margin o Revenues will rise more quickly in a rising cost environment, and may trend downward in a declining cost environment 106

INVESTMENT THESIS Favorable industry dynamics o Global consumer preferences toward synthetic products with innovative attributes 1 o Strong interest in sustainable solutions, with customers maintaining brand integrity Defensible scale and foundation ® o Leading branded recycled fiber, REPREVE o Global footprint with proximity to world-class brands and production centers 2 o Significant U.S. asset base with state-of-the-art technology and recycled fiber production Flexible operating model for expansion into new markets and geographies o Ability to use contract manufacturing or make direct investment 3 o Diverse markets and broad product lines drive long-term opportunities Strong balance sheet and cash flows could provide other avenues to accelerate growth and fuel strategic investments 4 107INVESTMENT THESIS Favorable industry dynamics o Global consumer preferences toward synthetic products with innovative attributes 1 o Strong interest in sustainable solutions, with customers maintaining brand integrity Defensible scale and foundation ® o Leading branded recycled fiber, REPREVE o Global footprint with proximity to world-class brands and production centers 2 o Significant U.S. asset base with state-of-the-art technology and recycled fiber production Flexible operating model for expansion into new markets and geographies o Ability to use contract manufacturing or make direct investment 3 o Diverse markets and broad product lines drive long-term opportunities Strong balance sheet and cash flows could provide other avenues to accelerate growth and fuel strategic investments 4 107
CLOSING SUMMARY 12 Kevin Hall | Chairman and CEO 108CLOSING SUMMARY 12 Kevin Hall | Chairman and CEO 108
STRATEGIC GROWTH PLAN PARTNER with brands, retailers and mills who win in their markets through sustainable innovation DELIVER INNOVATE Sales Growth with game-changing, Margin Expansion consumer-noticeable, sustainable technologies Free Cash Flow Shareholder Value BUILD a trusted global supply chain and a global commercial team INNOVATE focused on delivering solutions 109STRATEGIC GROWTH PLAN PARTNER with brands, retailers and mills who win in their markets through sustainable innovation DELIVER INNOVATE Sales Growth with game-changing, Margin Expansion consumer-noticeable, sustainable technologies Free Cash Flow Shareholder Value BUILD a trusted global supply chain and a global commercial team INNOVATE focused on delivering solutions 109

QUESTION & 13 ANSWER SESSION 110QUESTION & 13 ANSWER SESSION 110
THANK YOU 14 111THANK YOU 14 111
APPENDIX Sources for slide 21 1. Report shows a third of consumers prefer sustainable brands. (2017, May 01). https://www.unilever.com/news/press- releases/2017/report-shows-a-third-of-consumers-prefer-sustainable-brands.html 2. Generation Z wants more action for a sustainable future, reveals global research from Masdar. (2016, November 16). https://masdar.ae/en/media/detail/generation-z-wants-more-action-for-a-sustainable-future-reveals-global-rese 3. Mahler, D. (n.d.). Don't Give Up on Millennials. https://www.atkearney.com/web/america250/article?/a/article-don-t-give-up-on- millennials 4. Gen X: Midlife Purpose. (2017, April 06). https://www.wgsn.com/content/board_viewer/#/71848/page/1 5. Hartman Group. (2017, October 17). Sustainability and Boomers: All Talk, No Walk? https://www.hartman- group.com/hartbeat/717/sustainability-and-boomers-all-talk-no-walk- 112APPENDIX Sources for slide 21 1. Report shows a third of consumers prefer sustainable brands. (2017, May 01). https://www.unilever.com/news/press- releases/2017/report-shows-a-third-of-consumers-prefer-sustainable-brands.html 2. Generation Z wants more action for a sustainable future, reveals global research from Masdar. (2016, November 16). https://masdar.ae/en/media/detail/generation-z-wants-more-action-for-a-sustainable-future-reveals-global-rese 3. Mahler, D. (n.d.). Don't Give Up on Millennials. https://www.atkearney.com/web/america250/article?/a/article-don-t-give-up-on- millennials 4. Gen X: Midlife Purpose. (2017, April 06). https://www.wgsn.com/content/board_viewer/#/71848/page/1 5. Hartman Group. (2017, October 17). Sustainability and Boomers: All Talk, No Walk? https://www.hartman- group.com/hartbeat/717/sustainability-and-boomers-all-talk-no-walk- 112